Author


Tola Ore-Aruwaji
Developer Relations Engineer
Logstash is a free and open server-side data processing pipeline that ingests data from a multitude of sources, transforms it, and then sends it to your favorite “stash.” stash here is Axiom.
In this post, I will show you how to stream and run aggregations on Logstash logs.
Prerequisites
- Axiom dataset & Token.
- Logstash configuration file.
Logstash sits between your data and where you want to ingest into (Axiom). You can import logs from more than one source at a time on Logstash and output them to Axiom.
You can use Logstash to ingest a fleet of data into Axiom where it can then be analyzed and monitored easily.
With Logstash and Axiom, ingesting structured and unstructured data can be achievable in seconds.
After this tutorial, you will be able to:
- Analyze your logs from Logstash on Axiom
- Gather live events on your Logstash data.
- Customize dashboard and create alerts.
Let's get started! 🔥
- Visit our docs to copy and edit the
hosts,api_keyand the.conf fileon the Logstash configuration that sends data to Axiom:
input{
  exec{
    command => "date"
    interval => "1"
  }
}
output{
  elasticsearch{
    hosts => ["$YOUR_AXIOM_URL:443/api/v1/datasets/<dataset>/elastic"]
    # api_key can be your ingest or personal token
    api_key => "user:token"
    ssl => true
  }
}
The $YOUR_AXIOM_URL is the URL of your Axiom deployment. The user:token is the ingest token for your deployment (always in a string format such as xapt-274dc2a2-5db4-4f8c-92a3-92e33bee92a7 ).
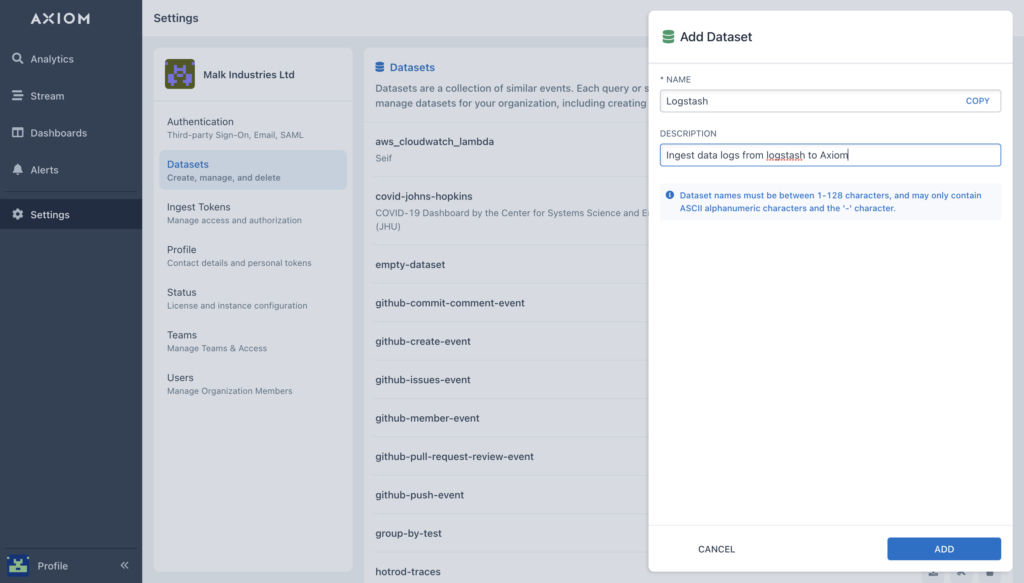
- Create your dataset for your Logstash logs by selecting Settings → Datasets.
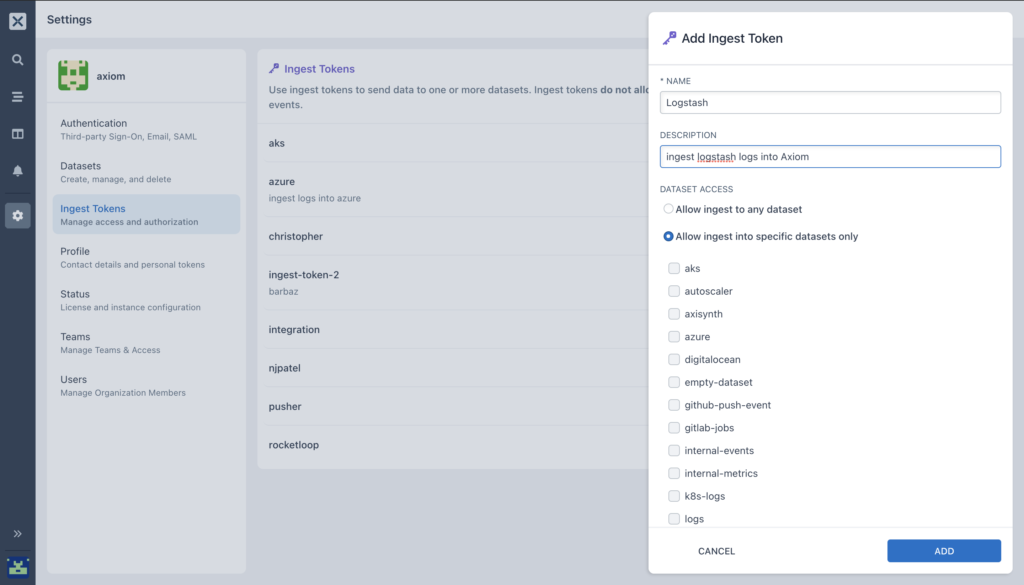
- Generate your ingest token,
- On the Axiom UI, click on settings, select ingest token.
- Select Add ingest token.
- Enter a name and description and select ADD.
- Copy the generated token to your clipboard. Once you navigate from the page, the token can be seen again by selecting Ingest Tokens.
-
Update the changes with the new Host URL and Dataset name on your configuration file so you can ingest logstash logs into Axiom.
-
Analyse and get queries using different aggregations on the Axiom UI.
- Stream and watch how your data is being ingested live from Logstash to Axiom.
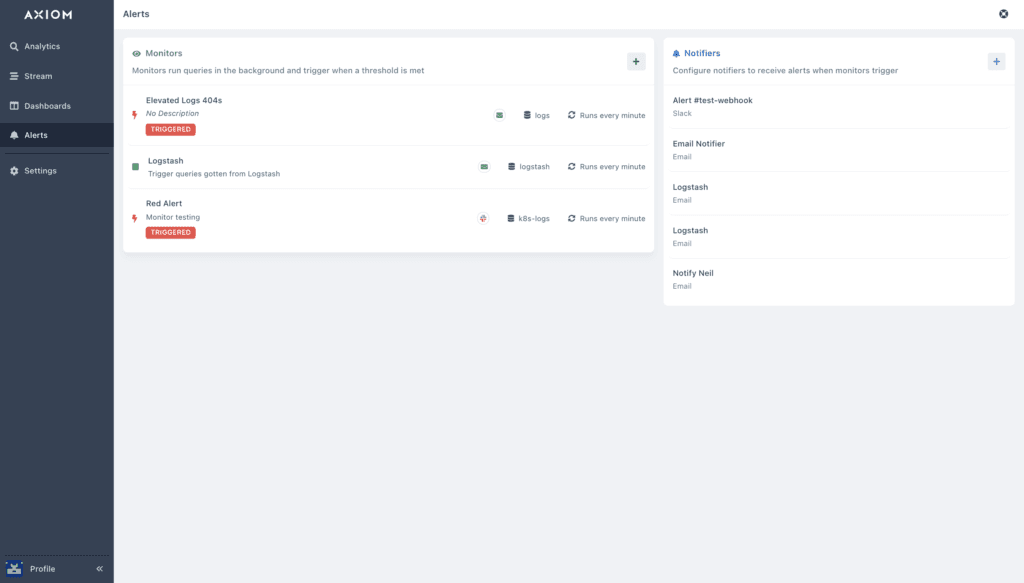
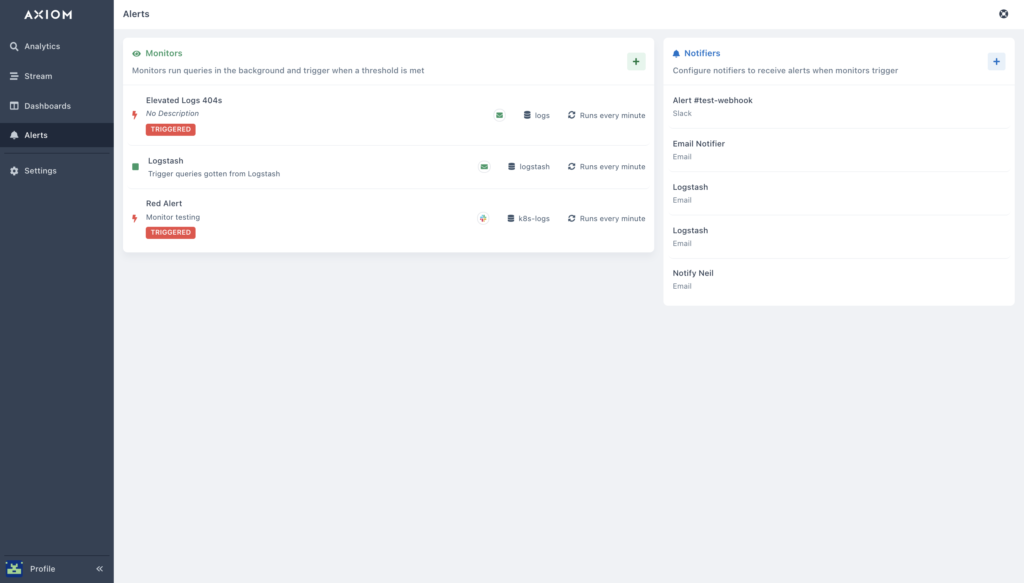
- You can also set up monitors and notifiers by selecting Alerts on the dashboard, with this you will get alerts when certain actions are met.
- With Monitors, you can set up and run queries over different periods. After configuring and setting up queries, you can confirm if the values created from the results exceed the threshold. If it exceeds the threshold value you configured, then the monitor would trigger and send an alert to the type of Notifier you added to the monitor.
- Before you configure your monitor, set up your notifier this is how your monitors will alert you when they are triggered.
You can set up different notifications through four different notifiers:
- Slack
- PagerDuty
- Webhook
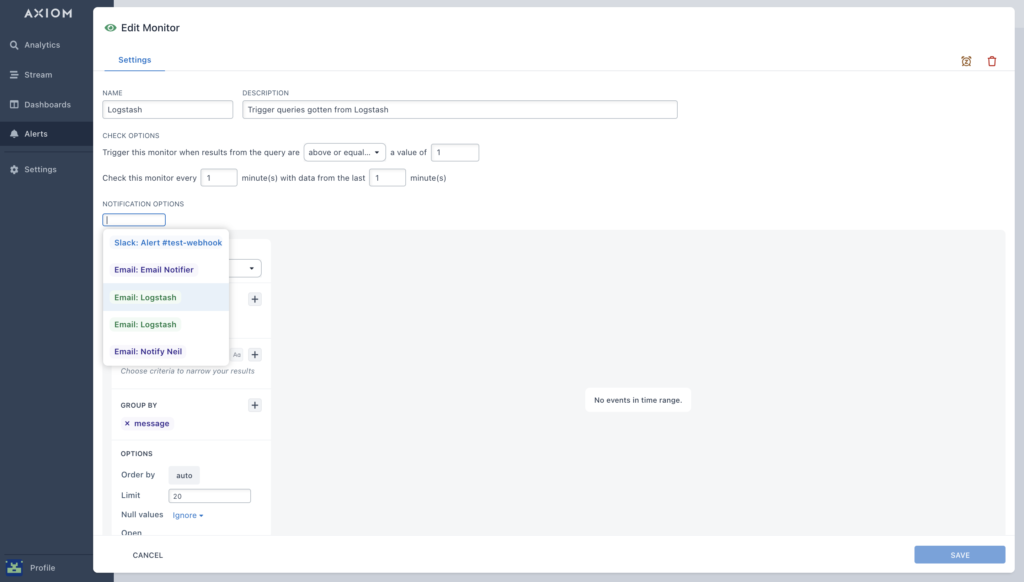
- Fill up the Monitor options, here the:
- Name of my monitor is: Logstash
- Description – Trigger queries gotten from Logstash, inserting a description is very useful especially for your team members, Helpful for team members so that they can know what it was created for.
- For Trigger options, I set the comparison type to above-or-equal to the value of 1. 1 is the value to compare the results of the query to.
- Specify the frequency and time range for your monitor. Here i configured mine to check this monitor for every 1 minute with data from the last 1 minute.
- Select your notification option. Here I’m selecting the notification via email which I configured in step 8.
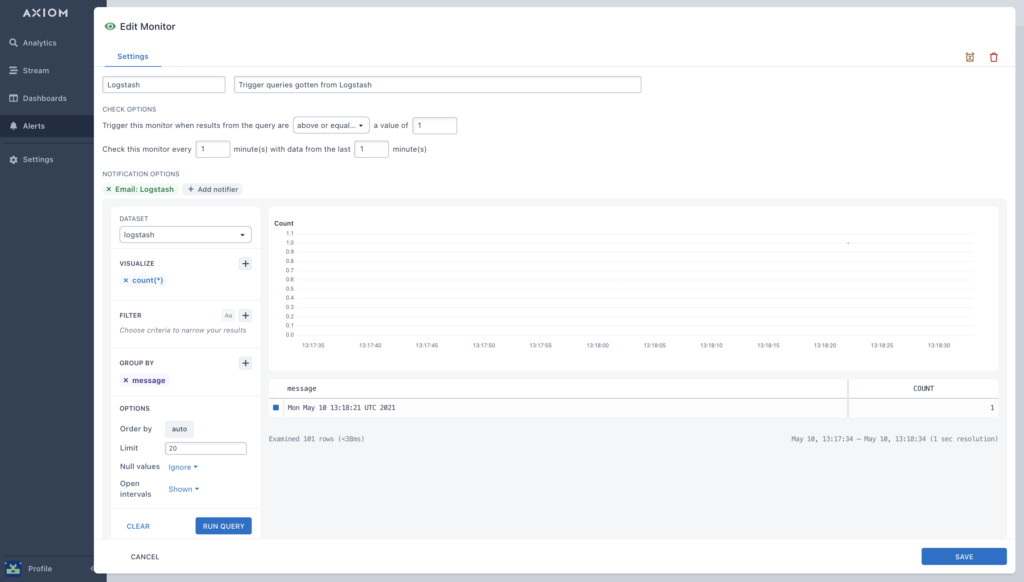
- Select the dataset in which you ingested logs from logstash earlier
- Wait for your query to run, Here I configured my query using the
countaggregation. It will trigger the monitor and send an alert to my email when the value of 1 is above or equal to the threshold value of 1.
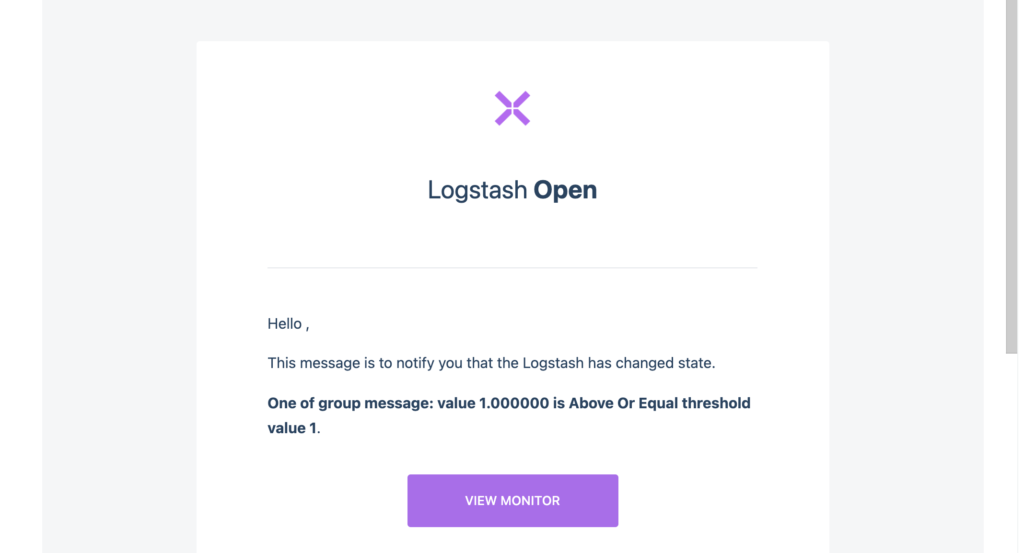
- Check your email to confirm if you received the trigger message. Here i received the alert that my Logstash alert has changed state. You can configure your monitors to get triggered at any
value,frequencyandtime range
Wait, you thought there was going to be more? Nope! 😉
- Read more about Logstash → Axiom Configuration on our docs.
- Setting up Monitors and Notifiers.
- Working with Aggregations.
- Getting started with Logstash
If you have specific questions or issues with the configuration, I’d love to hear about them. Contact us here or reach out to us on Twitter!