Author


Tola Ore-Aruwaji
Developer Relations Engineer
Modern DevOps is becoming more complex to handle manually, therefore monitoring and tracking your resources, container environments, and workload is strenuous.
In most cases, you have over a hundred different processes running on your Kubernetes environment maintaining such setup to run smoothly and without application downtimes is very challenging. Happily, with Axiom’s serverless log management solution, you can analyze, track, monitor, and observe your highly dynamic container environment like Kubernetes, Docker Swarm easily without worrying about your Infrastructure.
In this tutorial, I will show you how to:
- Create an IBM Kubernetes Cluster on IBM
- Ingress logs from IBM Kubernetes Service to Axiom
- Create a dataset & Ingest token on Axiom.
- Analyze your IBM Kubernetes logs on Axiom.
- Create alerts to be notified when a pod changes state.
Prerequisites
- Axiom Dataset & Token
- Access to Axiom cloud
- IBM account created and Kubernetes engine configured.
Let's get Started 🌟
-
Create your account on IBM, and configure your cluster.
-
Confirm to be sure that your current context is the same as the cluster you created.
- Run
kubectl config get-contextsto see the clusters you set-up kubectl config current-contextstells you which cluster is your activekubectl config use-context [name]lets you switch to a different one.- You can see the names and status of the different nodes on your terminal by running
kubectl get nodes
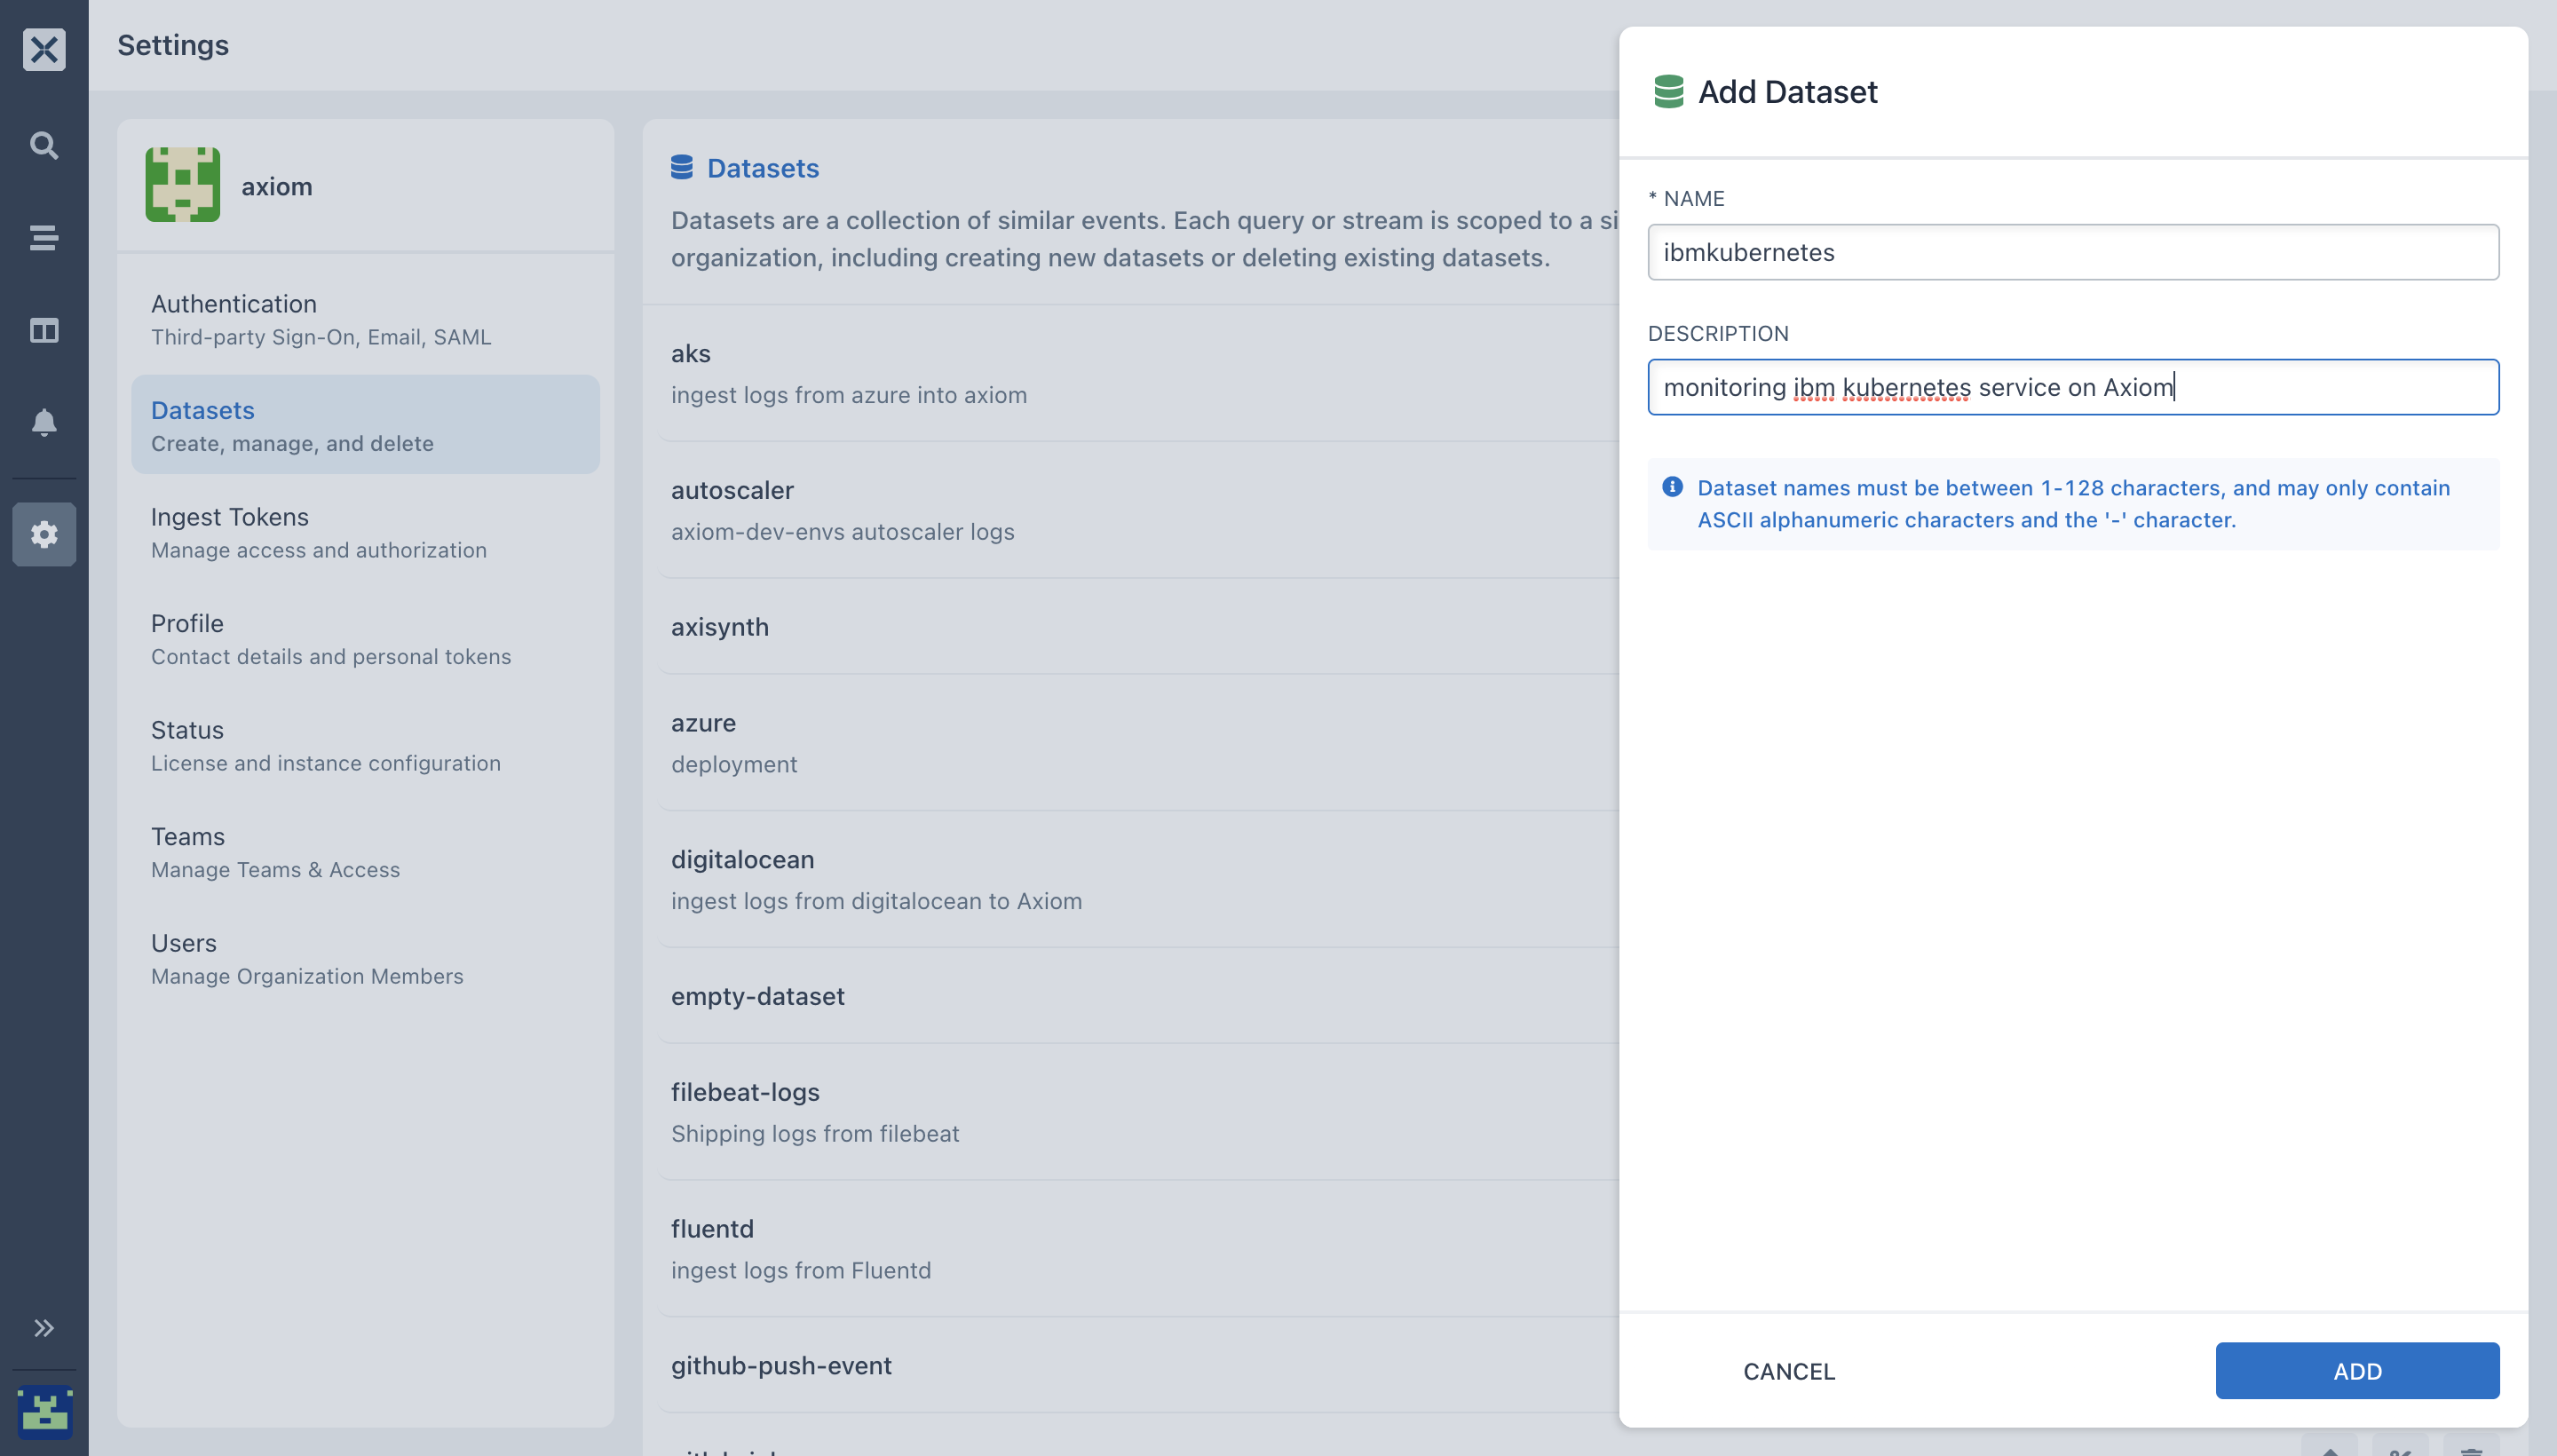
- Create your dataset for your IBM service by selecting Settings → Datasets.
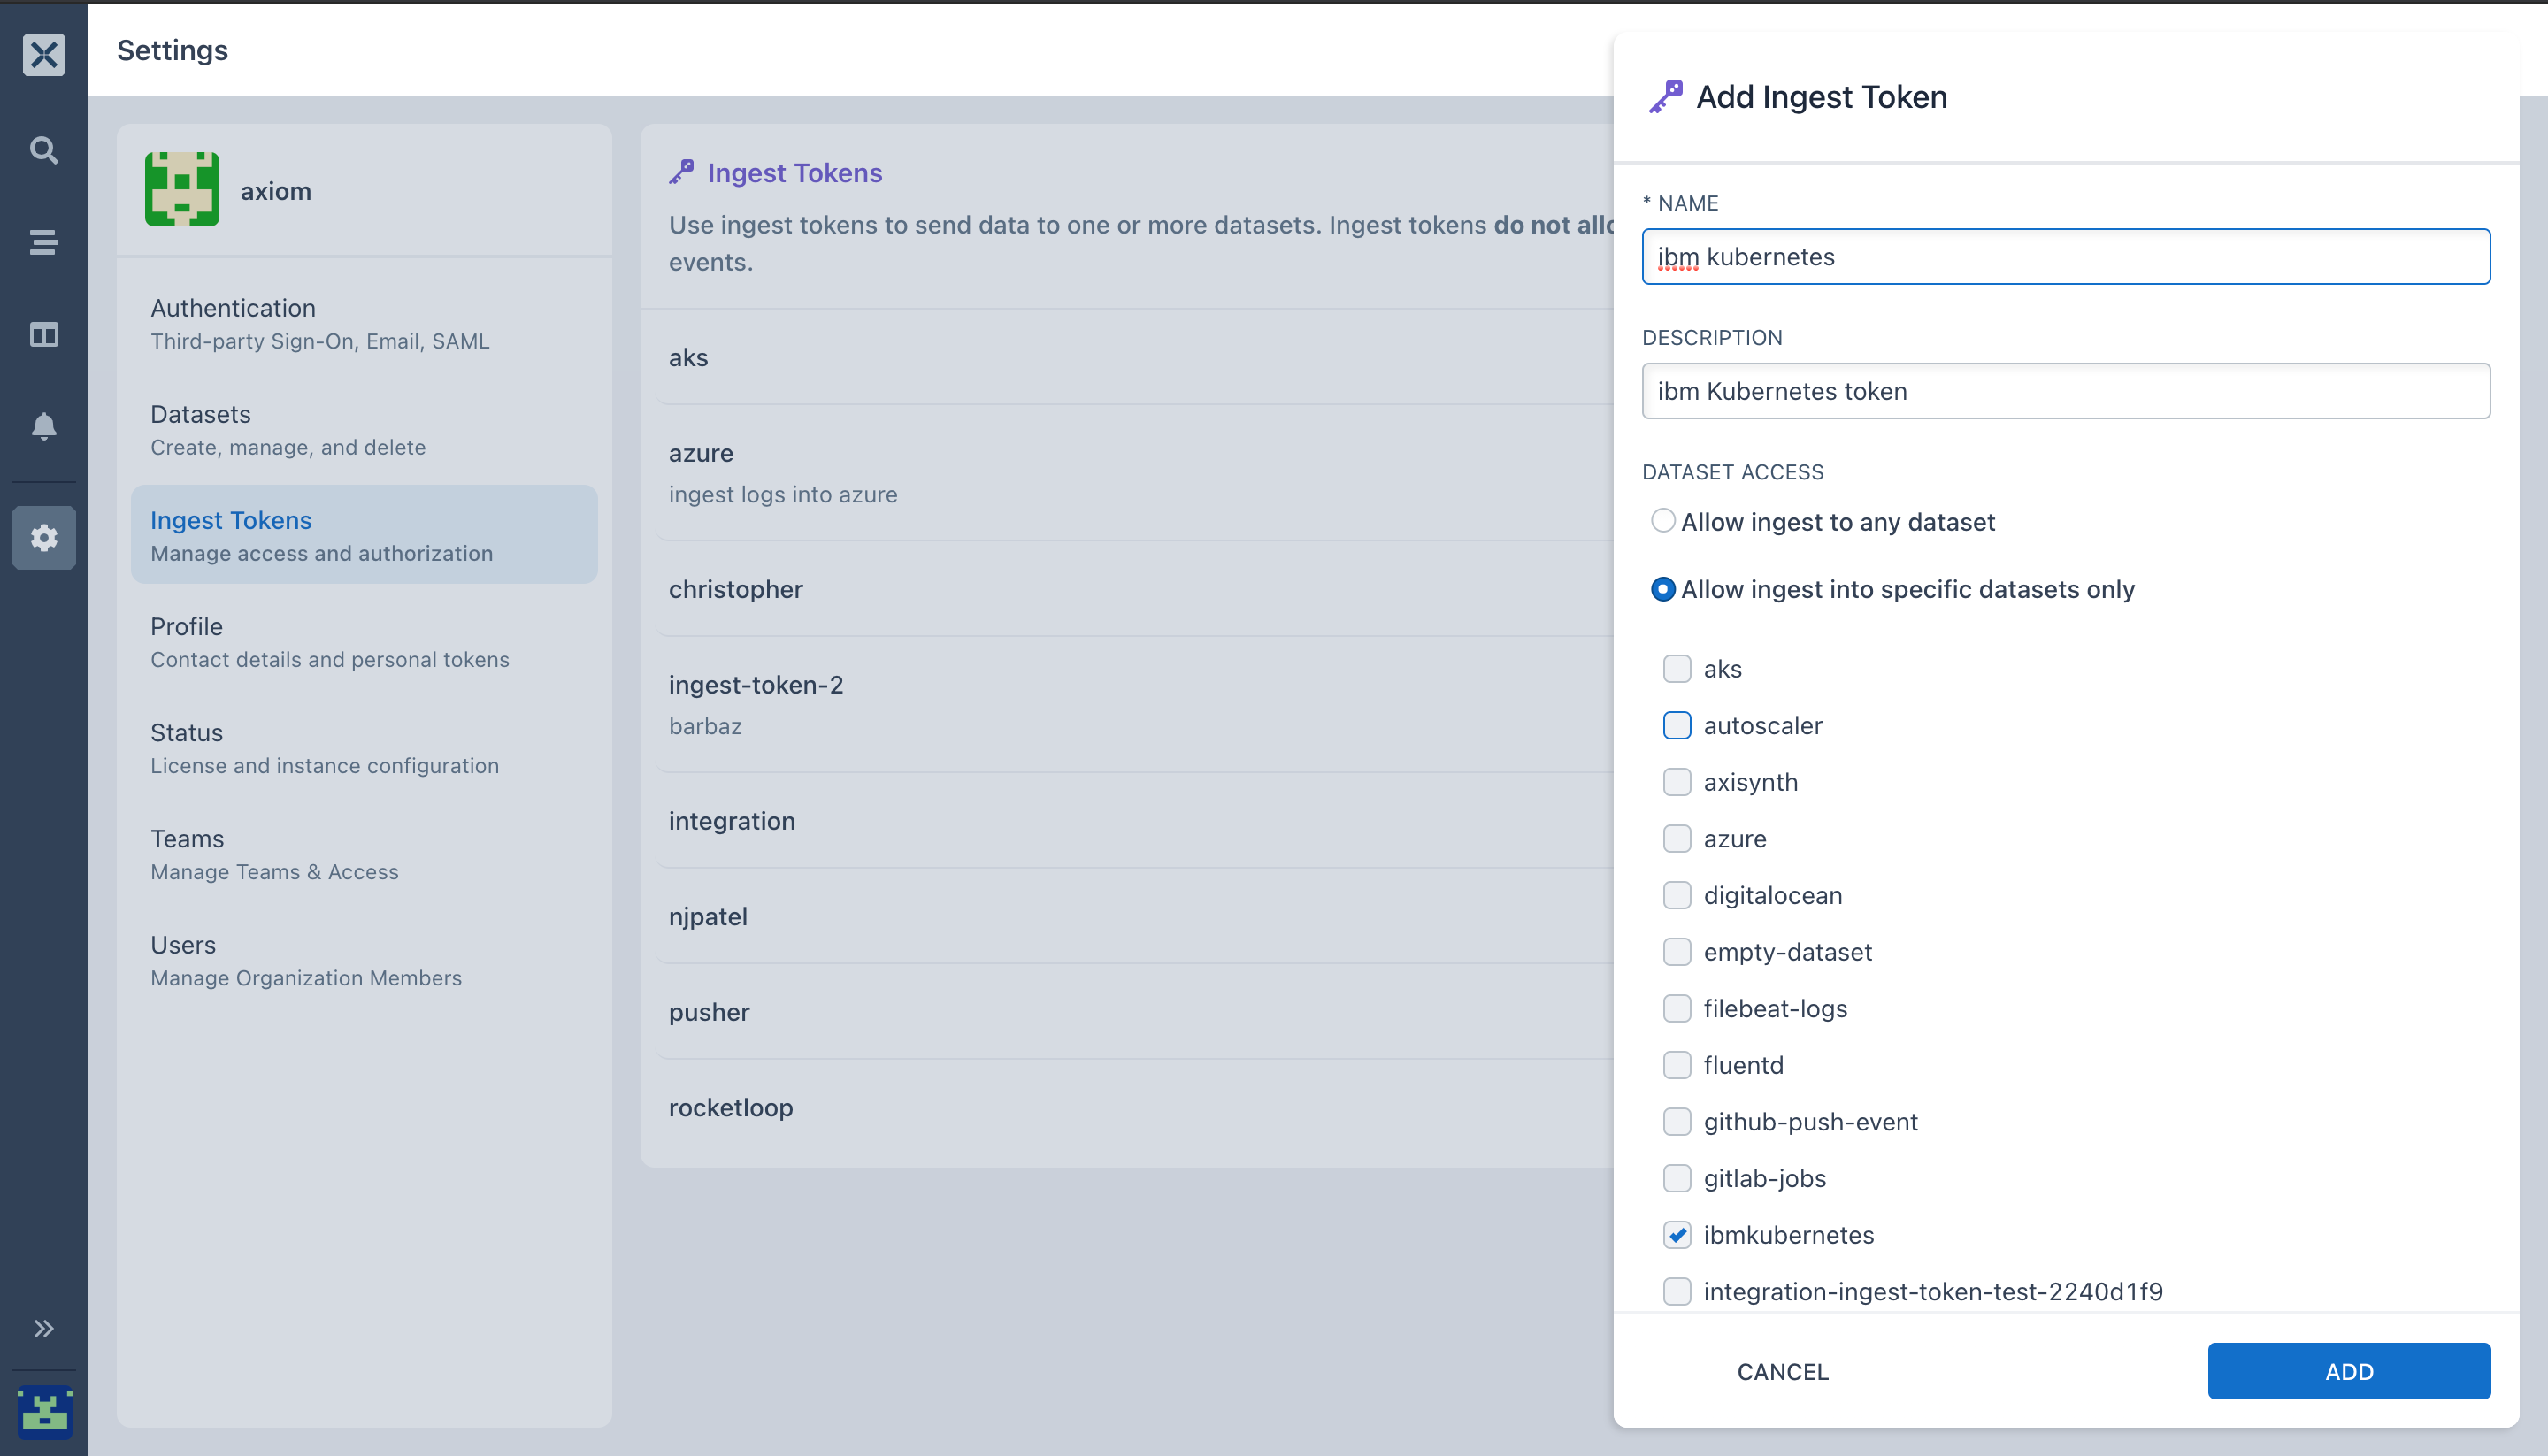
- Generate your ingest token,
- In the Axiom UI, click on settings, select ingest token.
- Select Add ingest token.
- Enter a name and description and select ADD.
- Copy the generated token to your clipboard. Once you navigate from the page, the token can be seen again by selecting Ingest Tokens.
- Axiom uses Filebeats to forward logs from your Kubernetes cluster. Setting it up is as simple as copying the daemonset's
yamlfile from the Axiom Docs and configuring it by adding the environment variable values for your Axiom host, dataset, and the ingest token.
env:
	- name: AXIOM_HOST
	  value: https://app.axiom.co // replace with your self-host url if needed
	- name: AXIOM_DATASET_NAME
	  value: aks-logs
	- name: AXIOM_INGEST_TOKEN
	  value: xait-xxxxxxxx-xxxx-xxxx-xxxx-xxxxxxxxxxxx
And apply and run your.yaml file using kubectl apply -f (NAME OF FILE).yaml.
- Analyze and get queries using different aggregations on the Axiom UI.
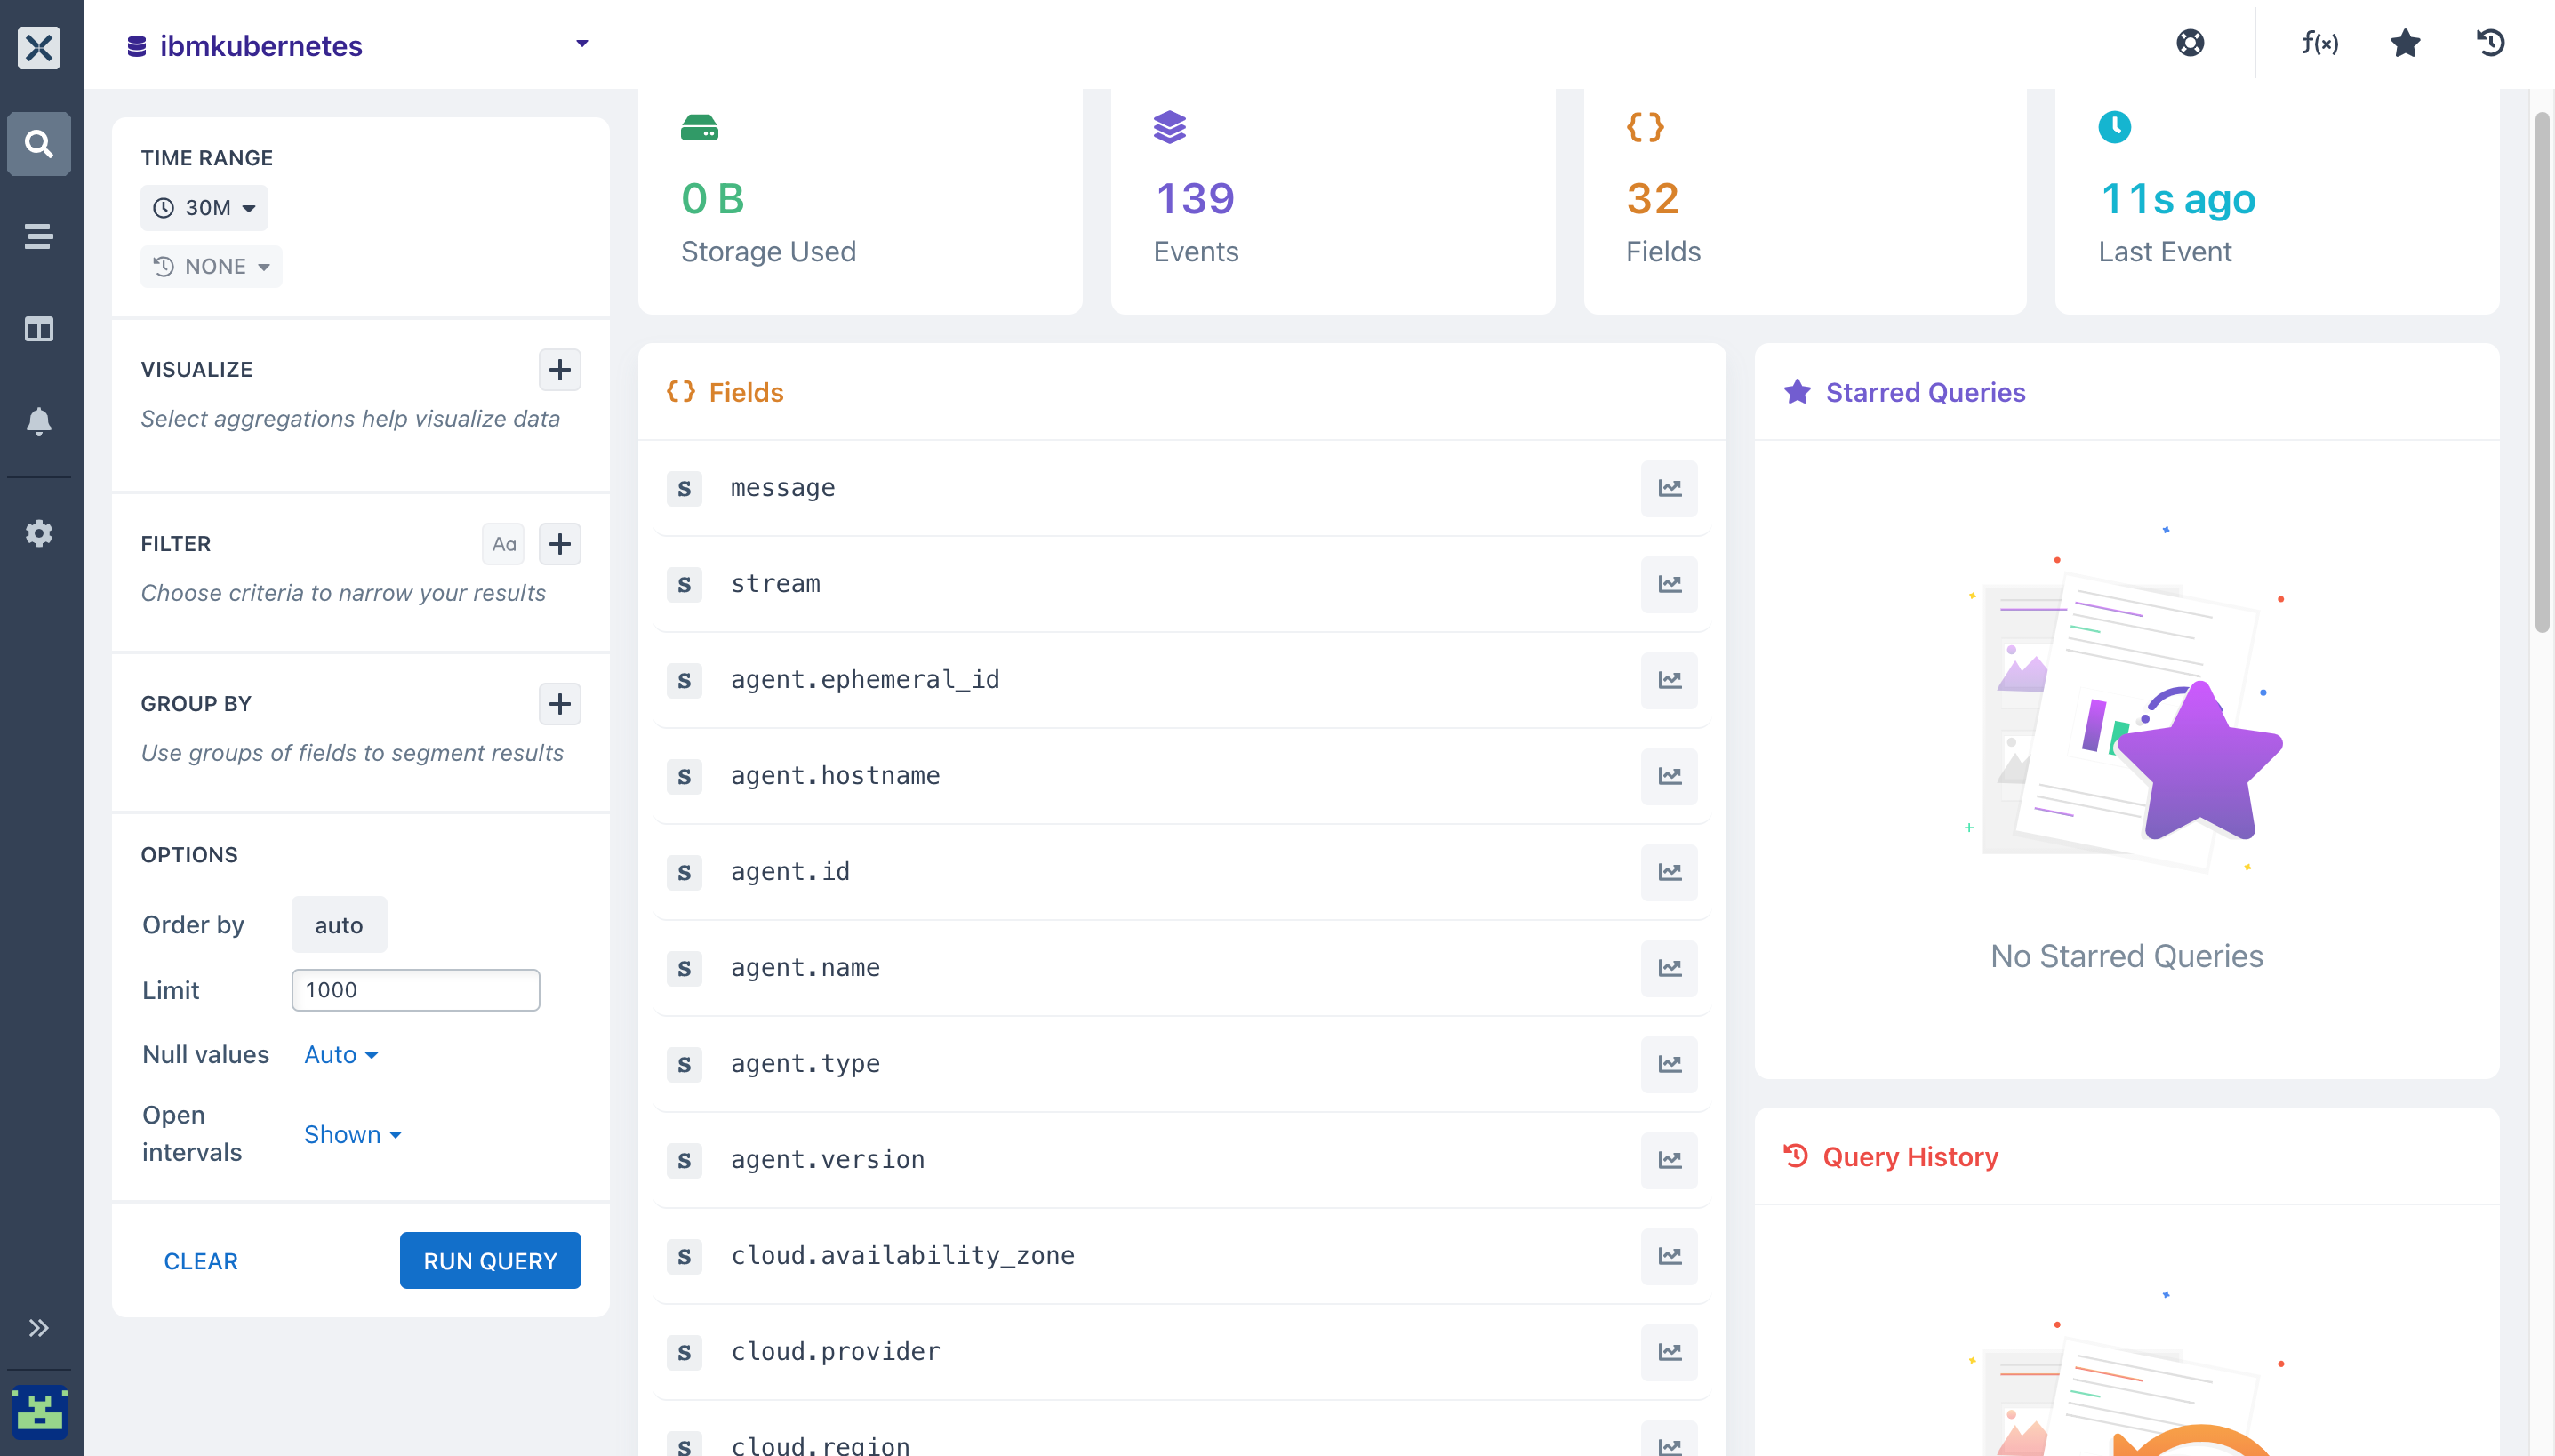
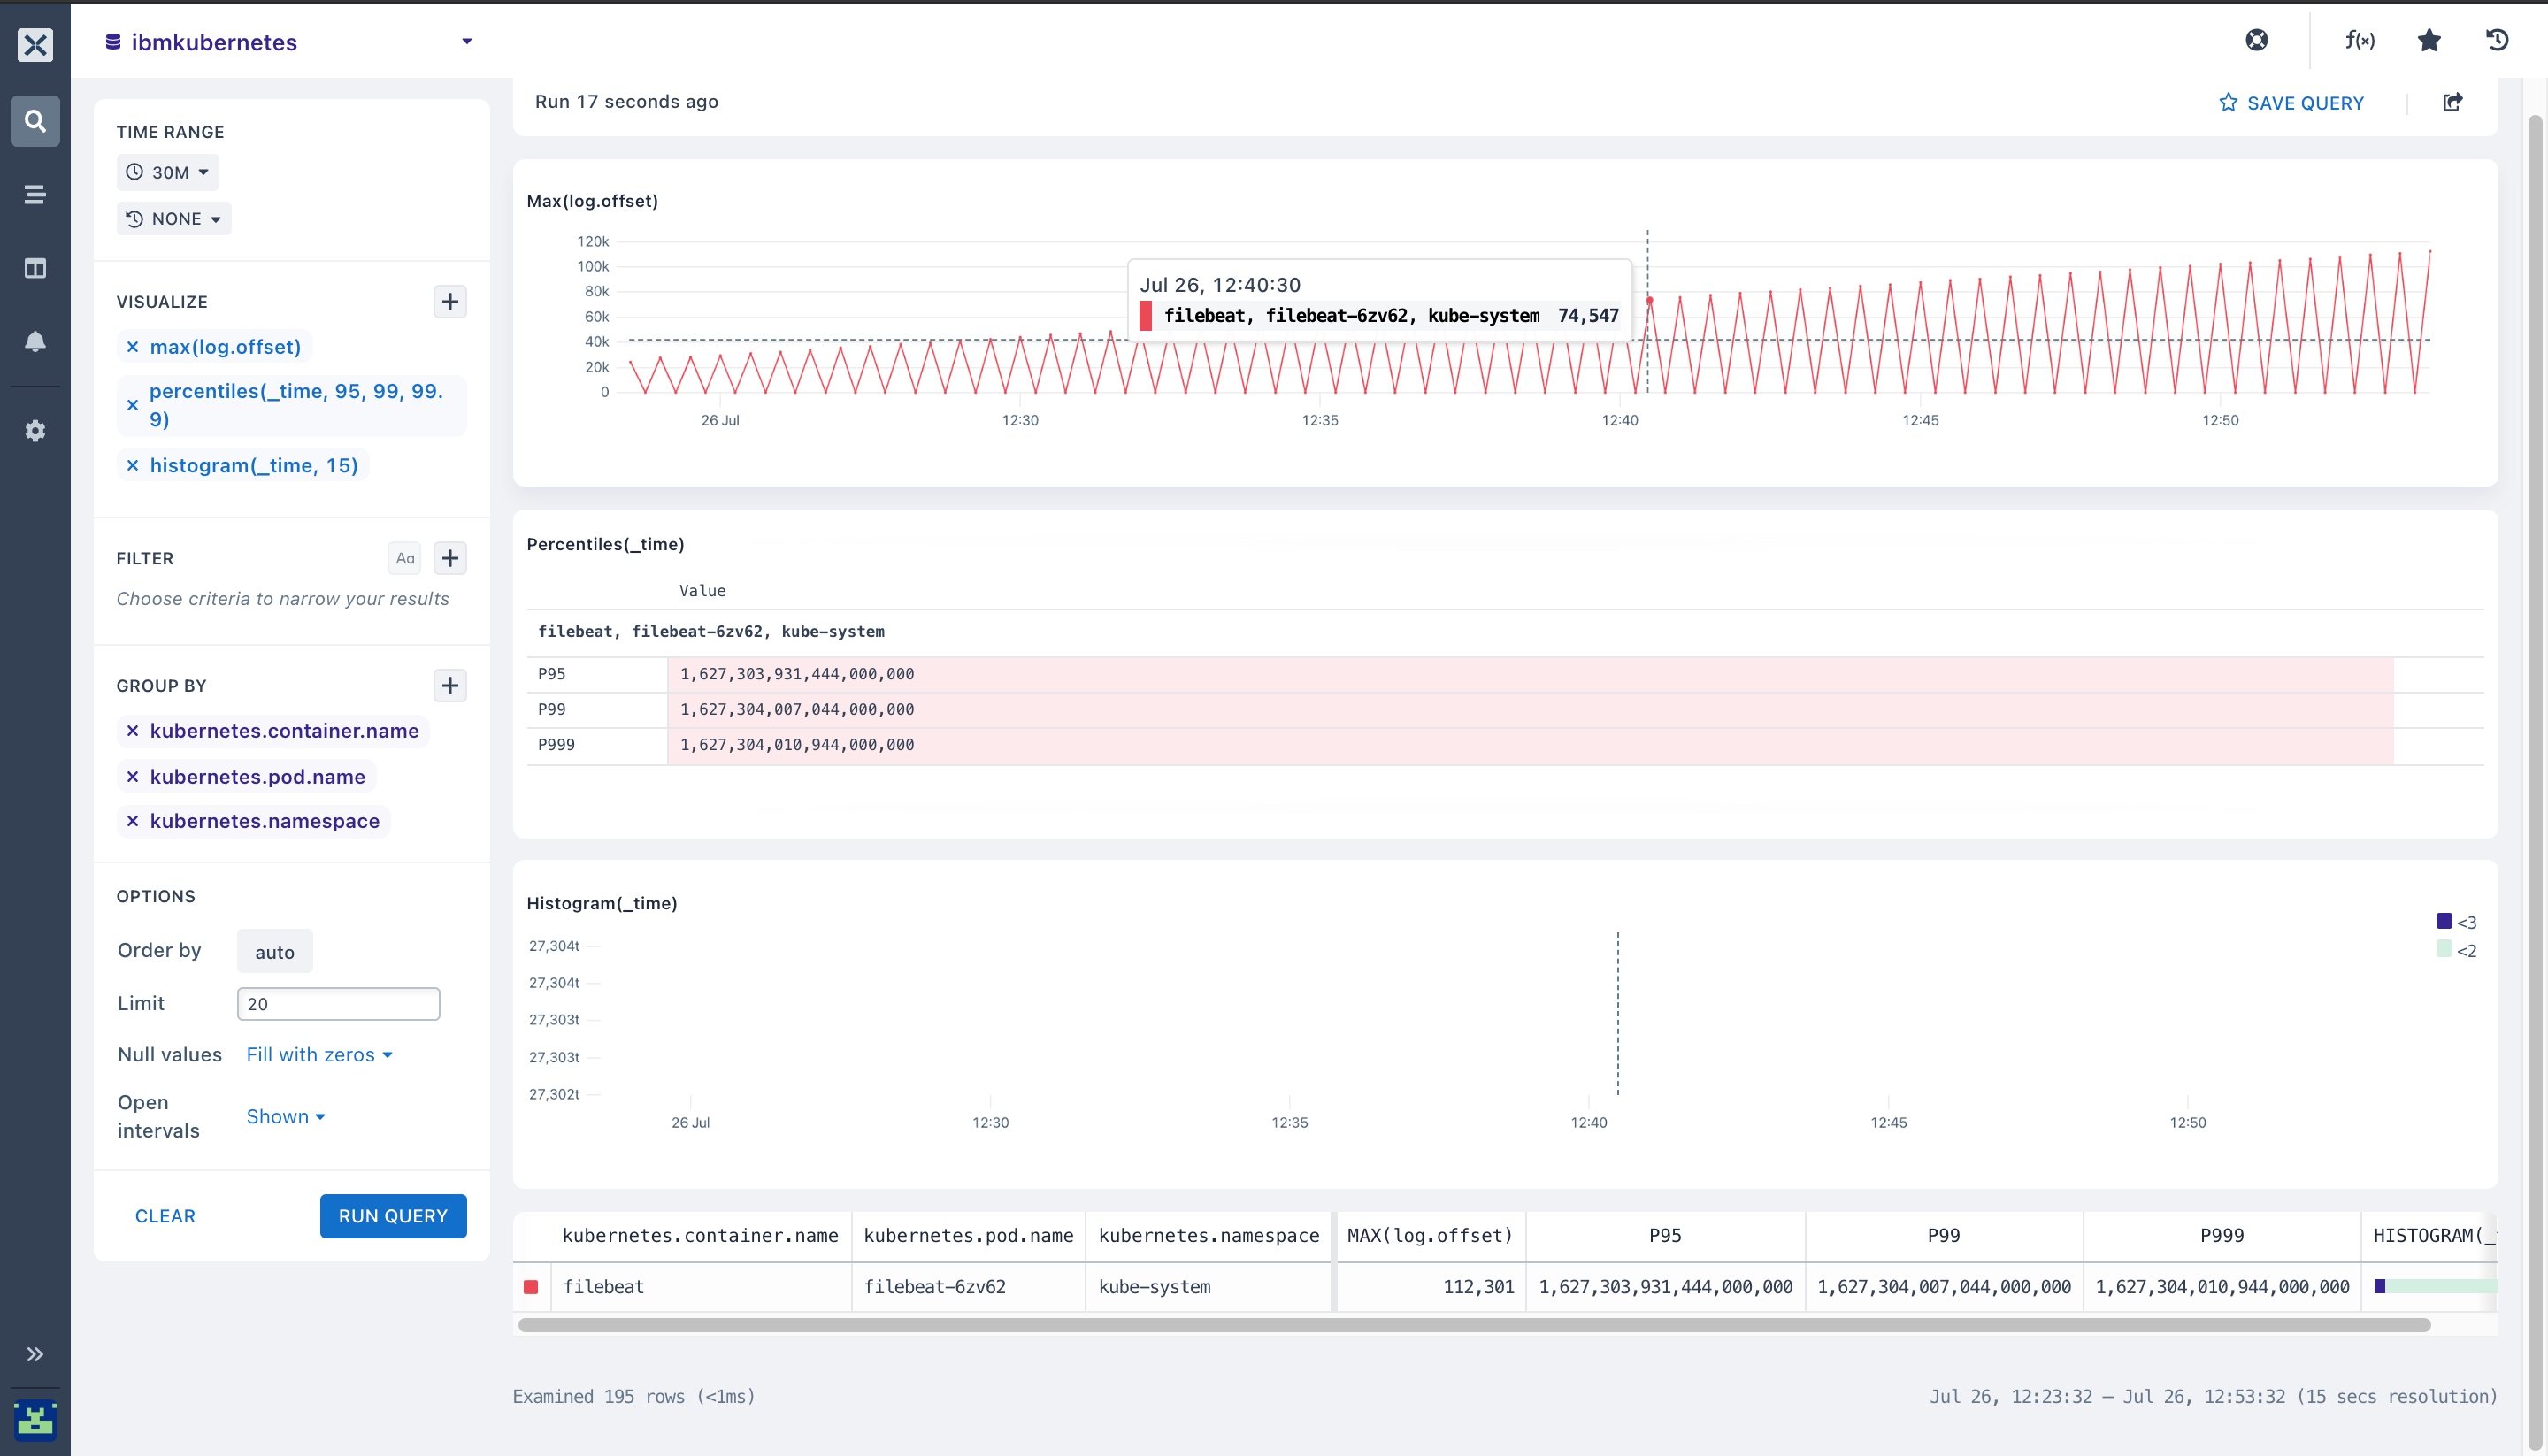
- You can group and extract statistics/insights from your IBM Kubernetes events by running aggregations across all of your datasets: Below is a list of aggregations I am running on my IBM dataset.
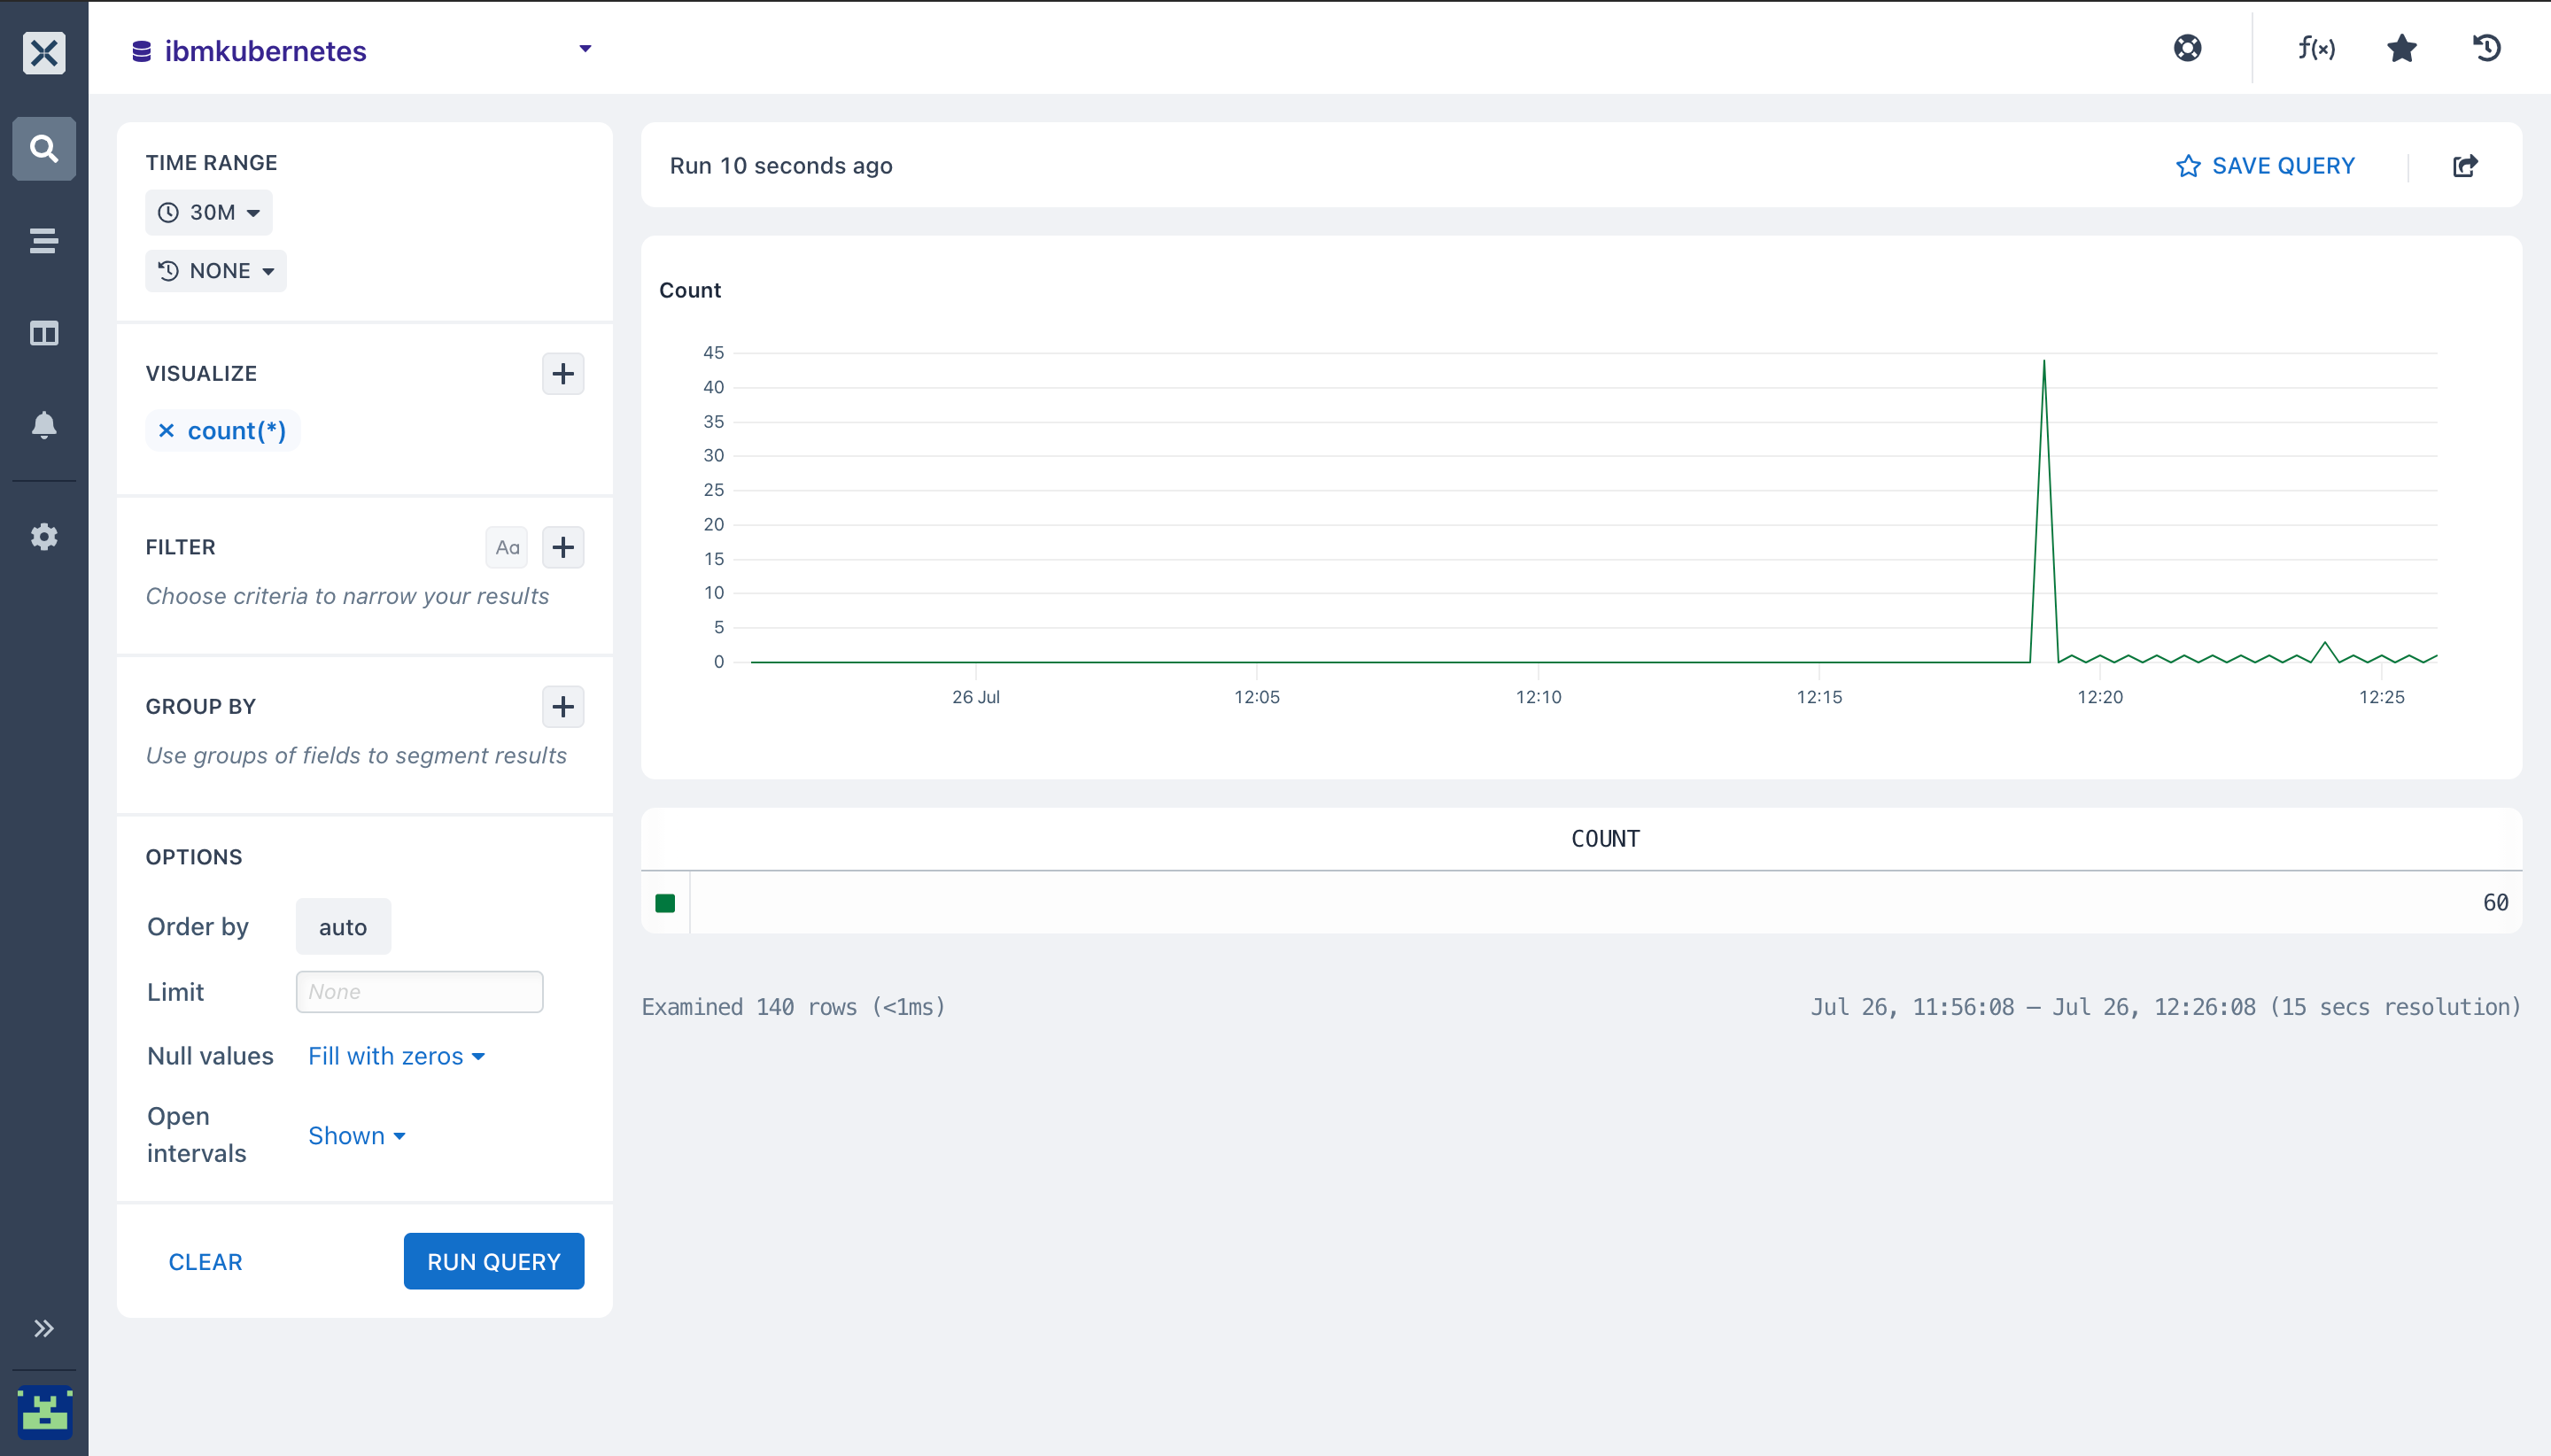
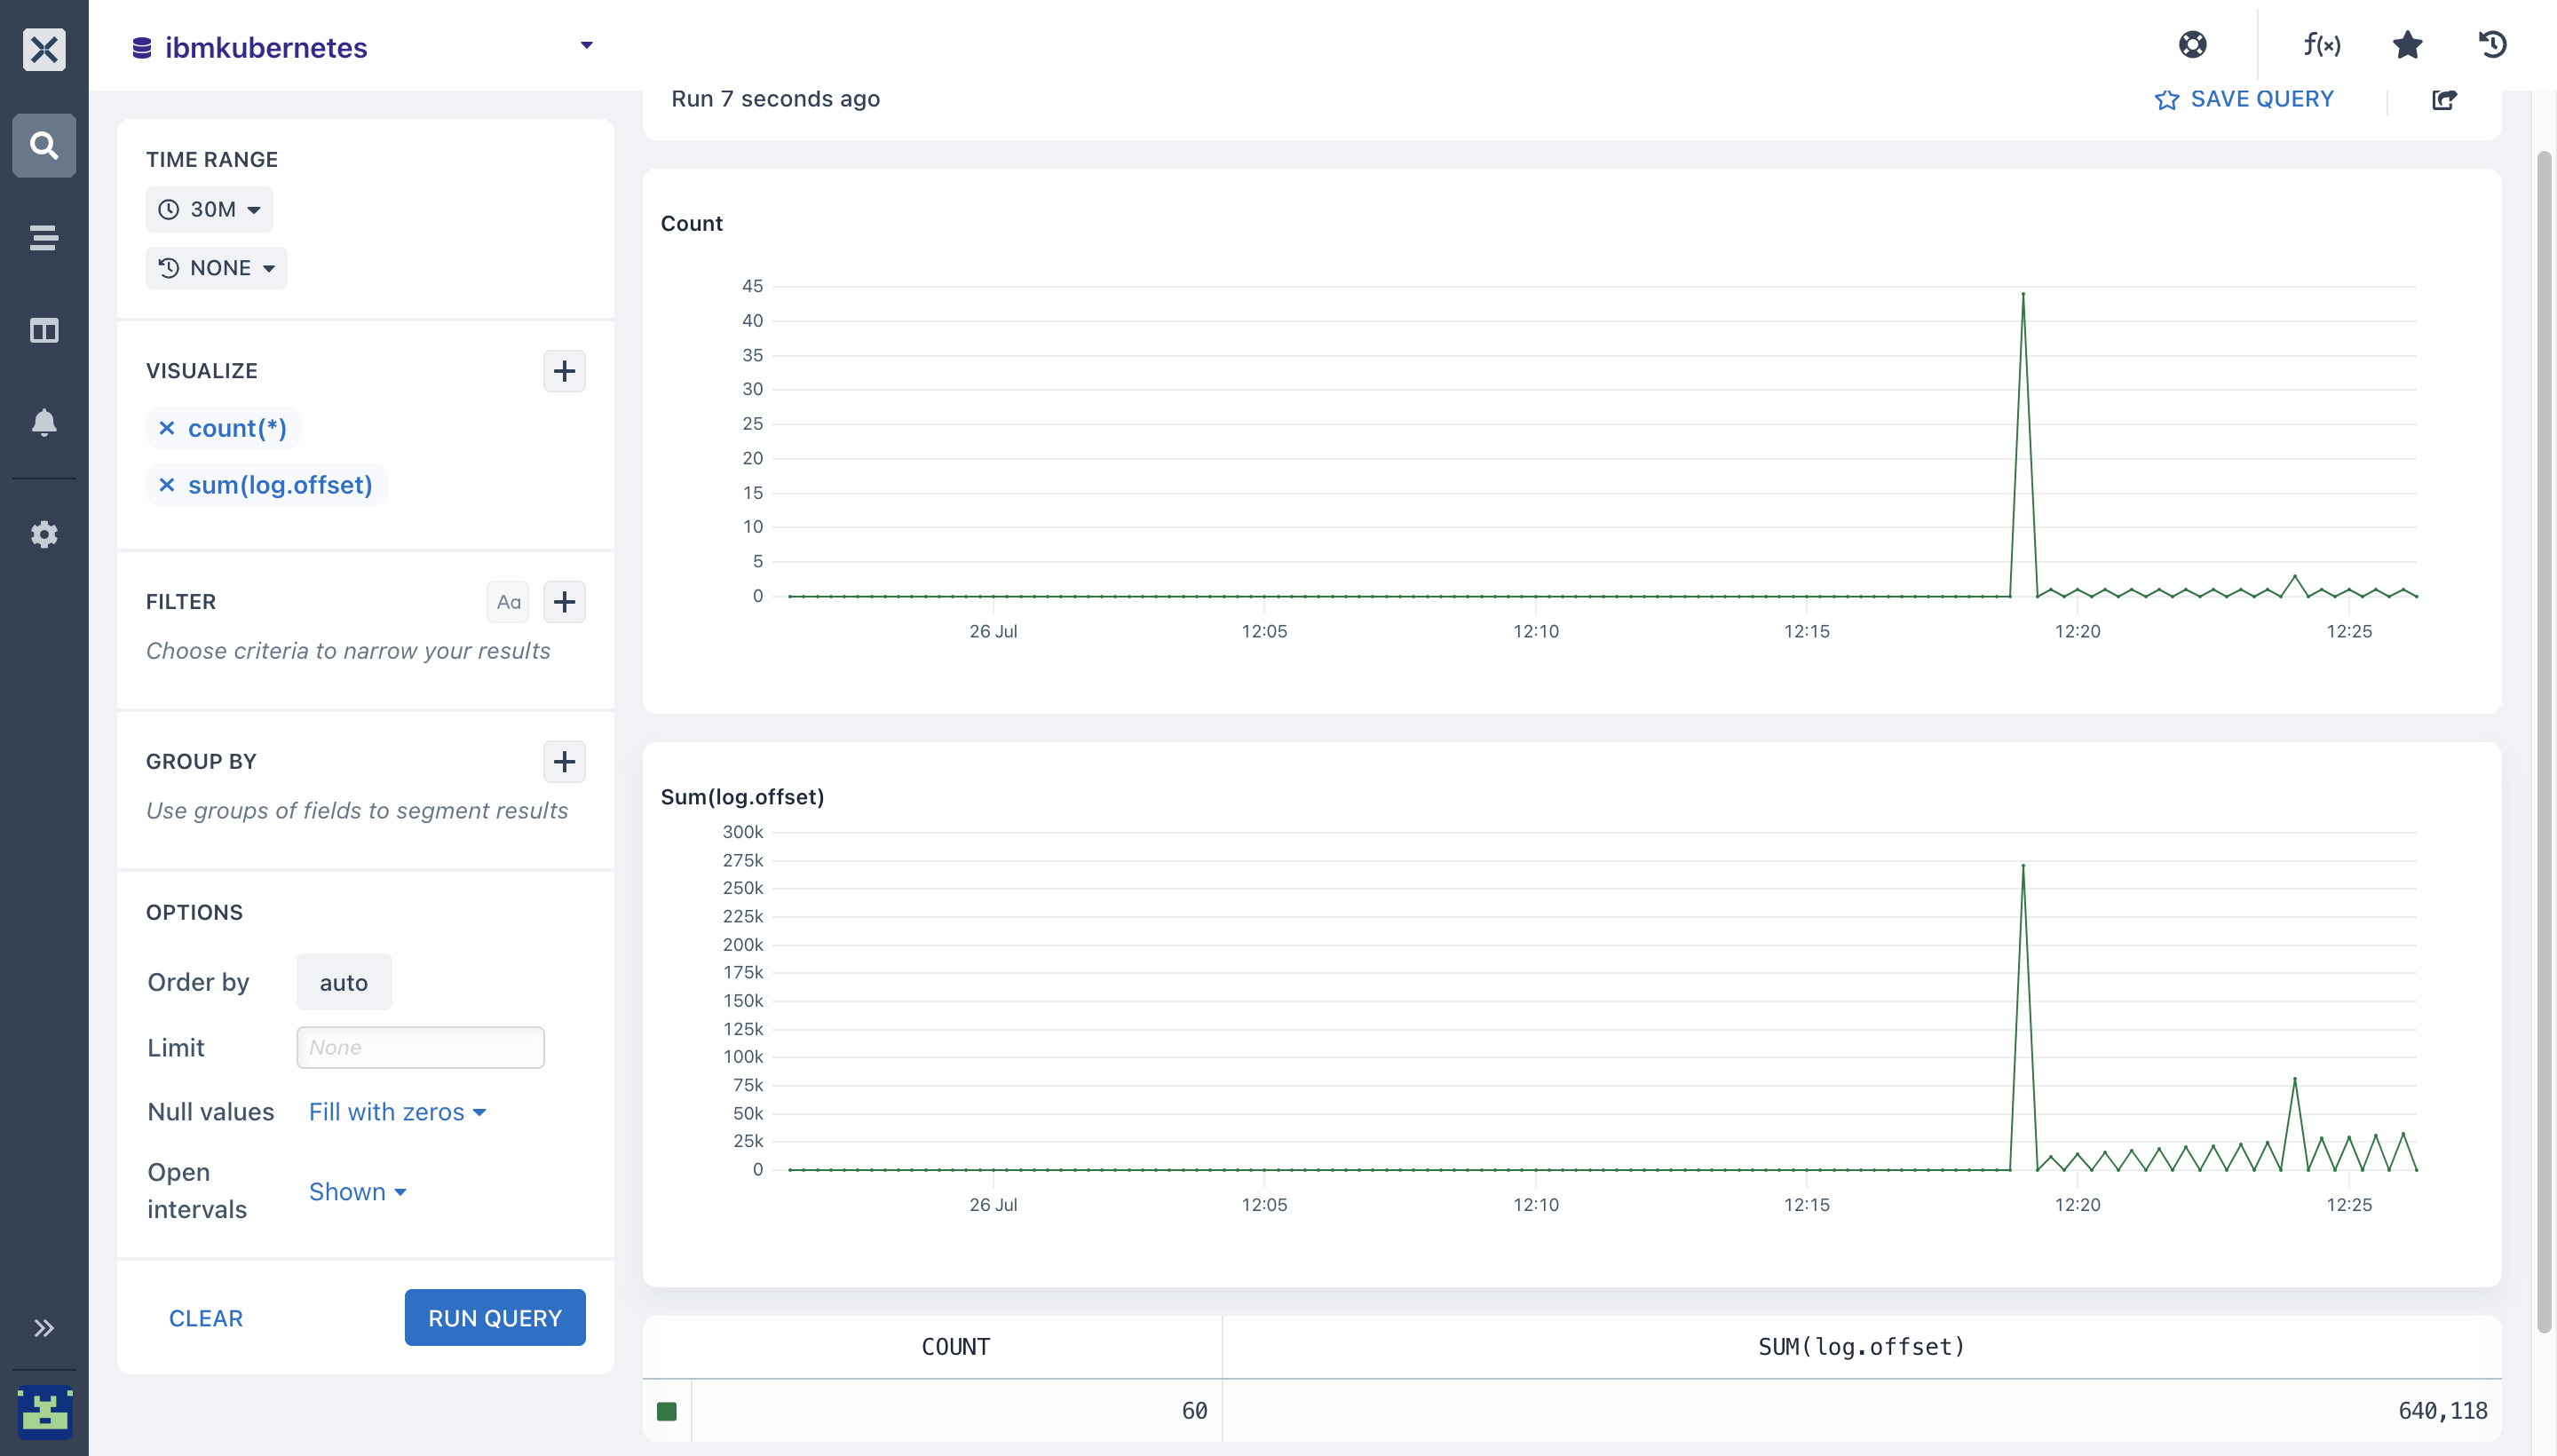
- Count(): Here I am running the
countaggregation, this will count all matching events in youribmkubernetesdataset, bucketed by a time duration then a line chart is then rendered with the returned data that shows the number of events in each time data.
- Sum(): The Sum aggregation calculates the total value for a field across the query time range.
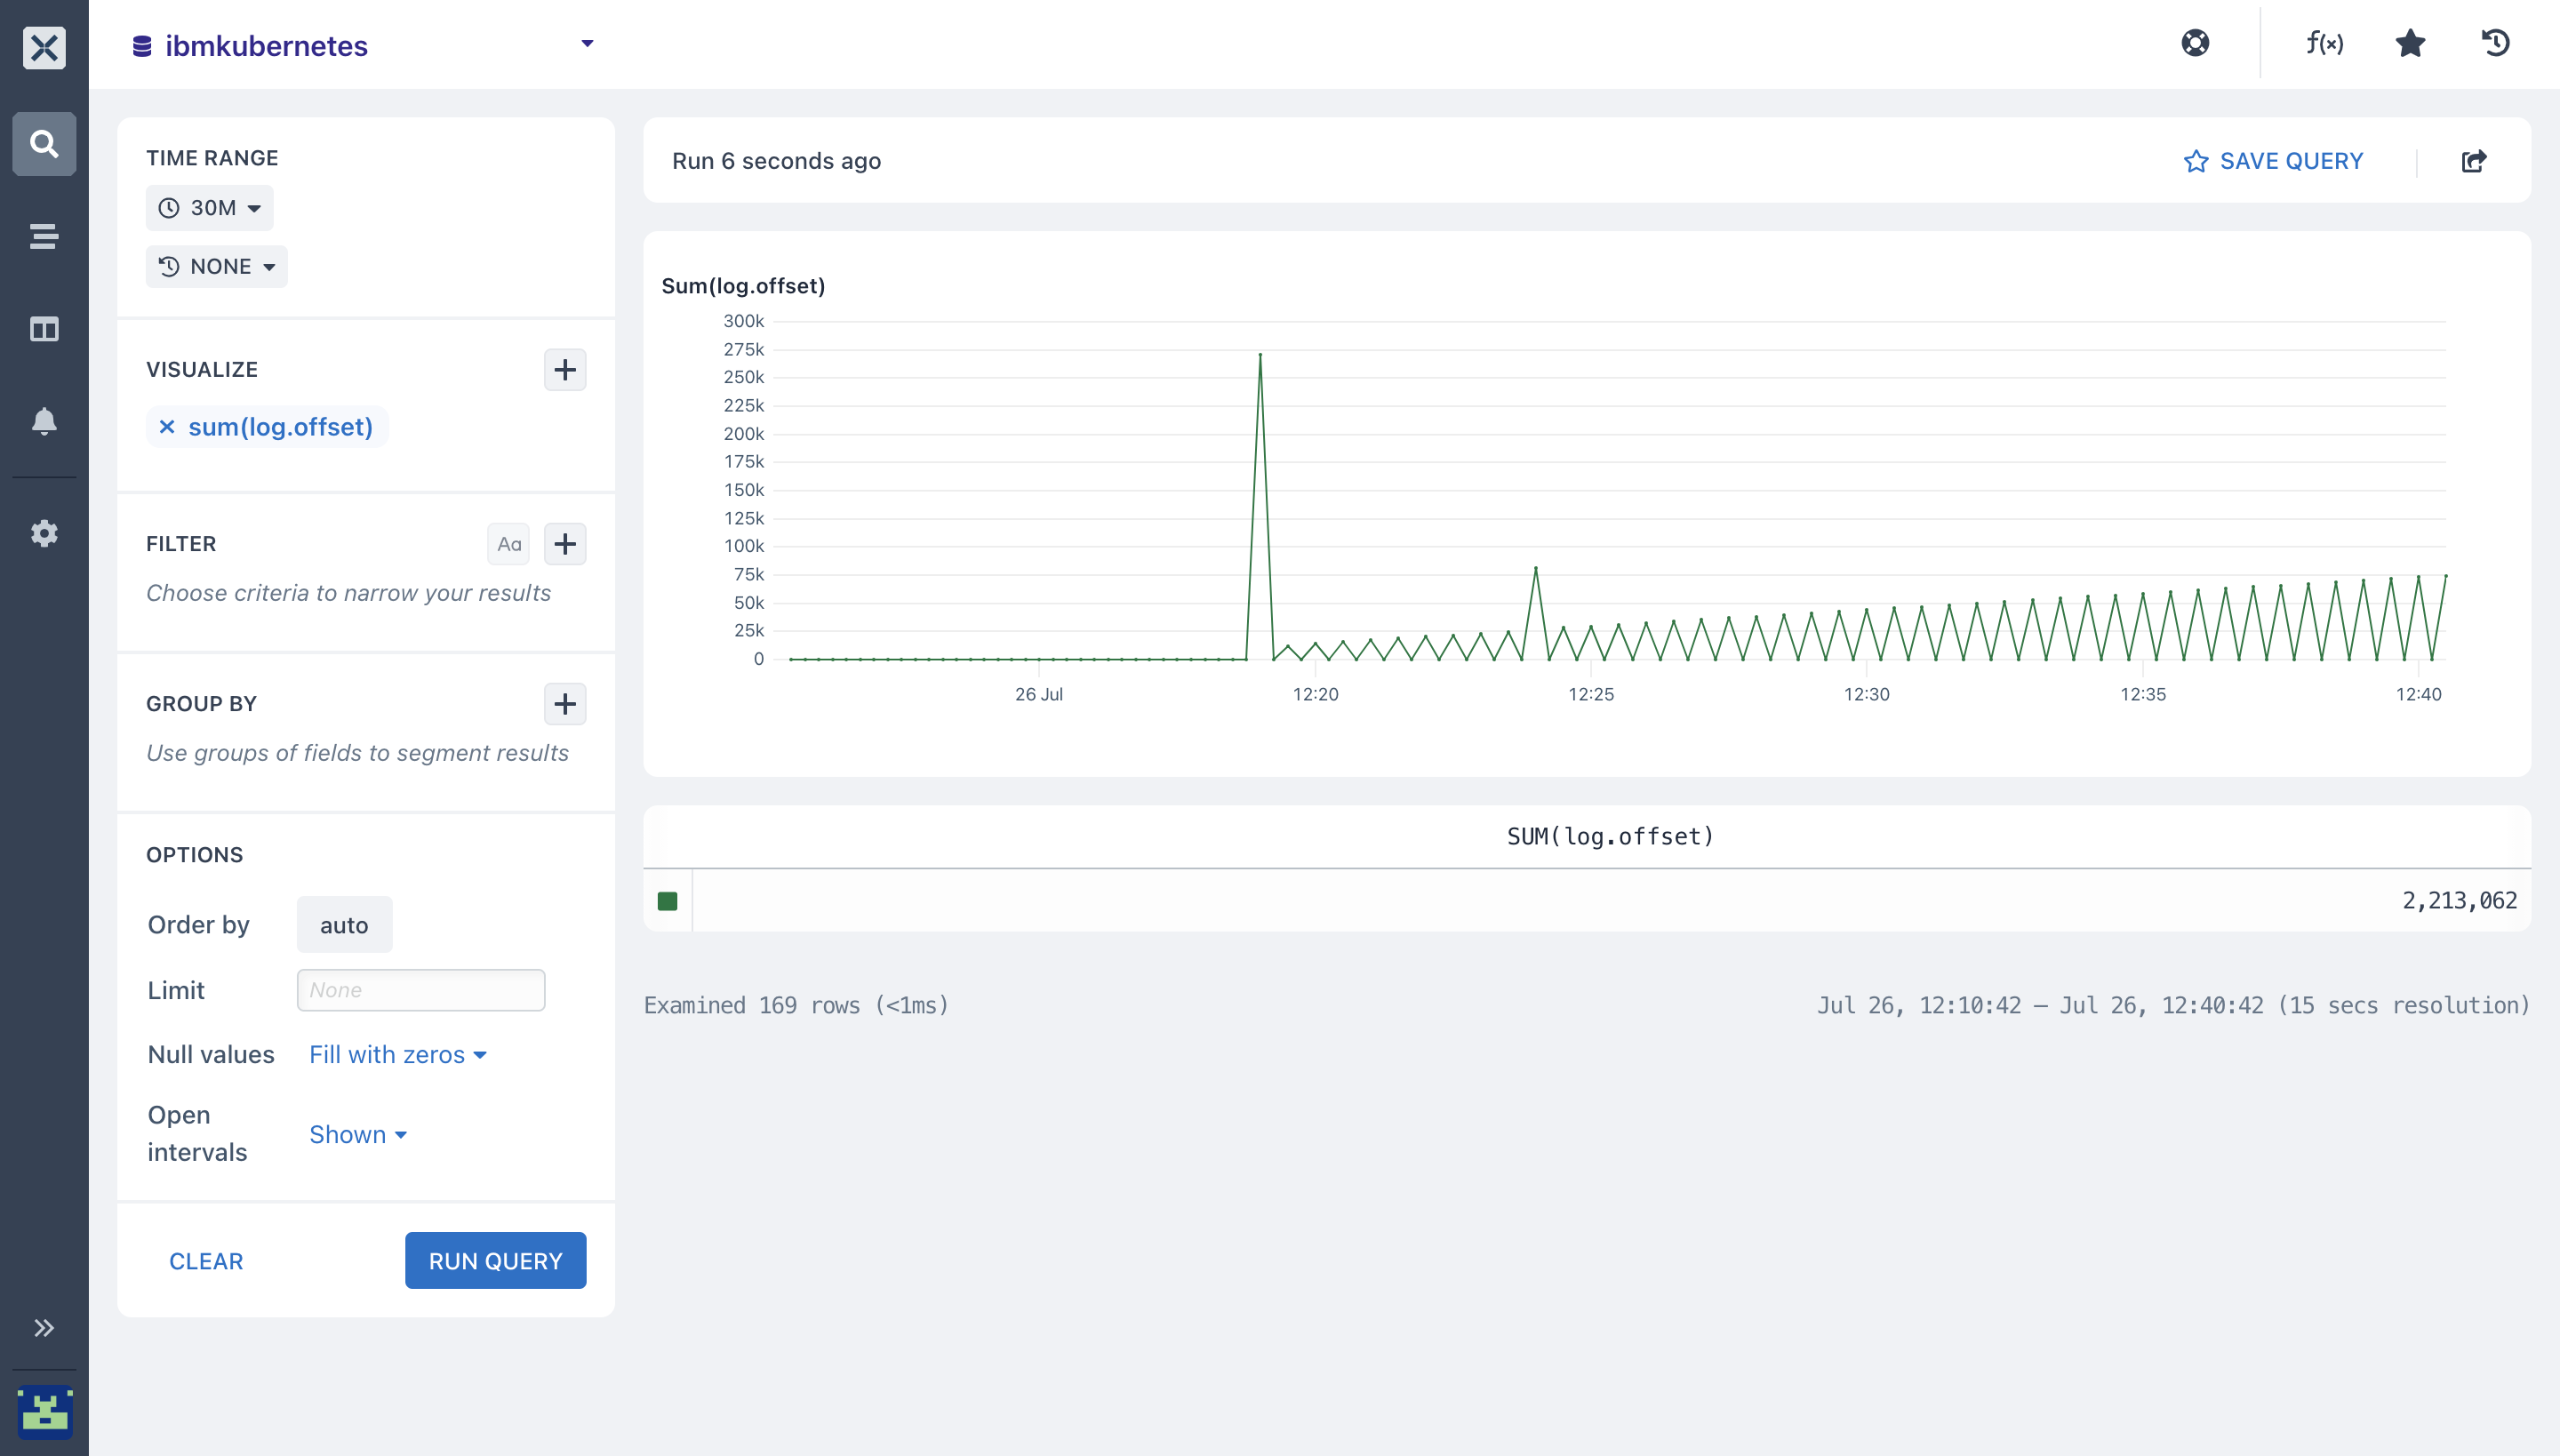
Select the field you want to run the sum aggregation on.
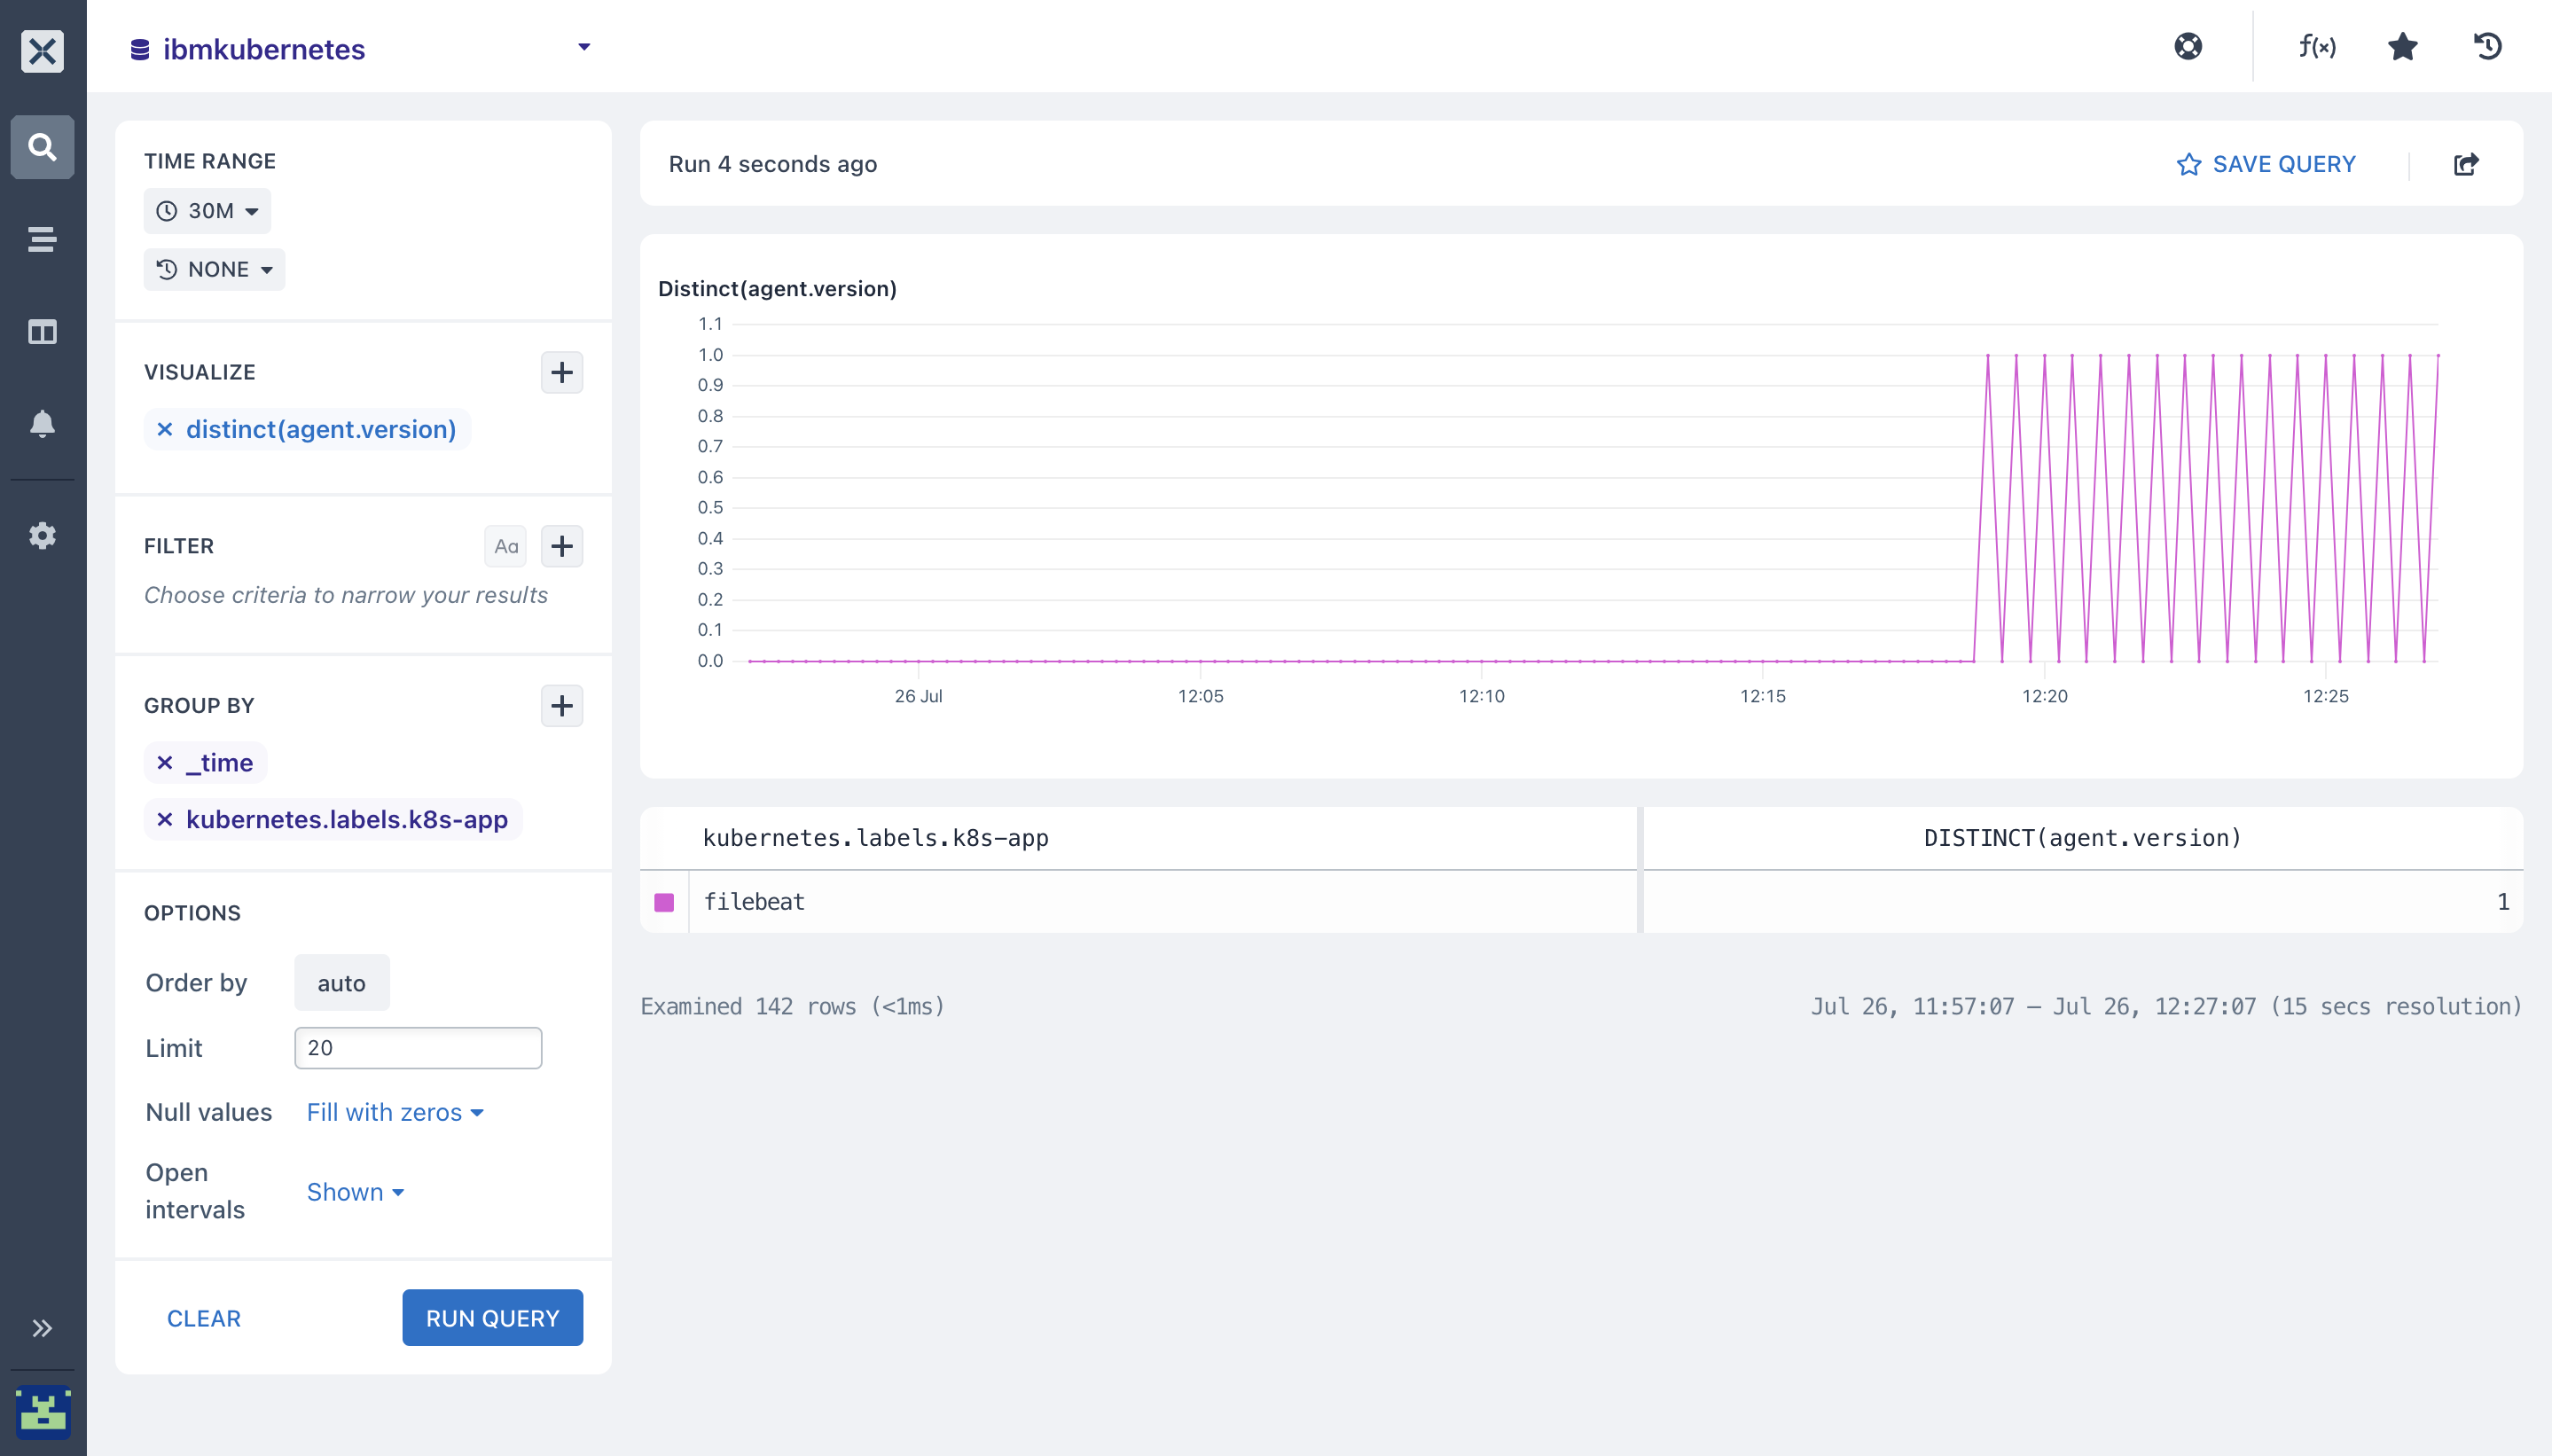
- distinct(): The Distinct aggregation calculates the number of unique values for a field in each time duration in your
ibmkubernetesdataset. You can specify thedistinct($fieldName)function to get the chart for the values in the field you selected.
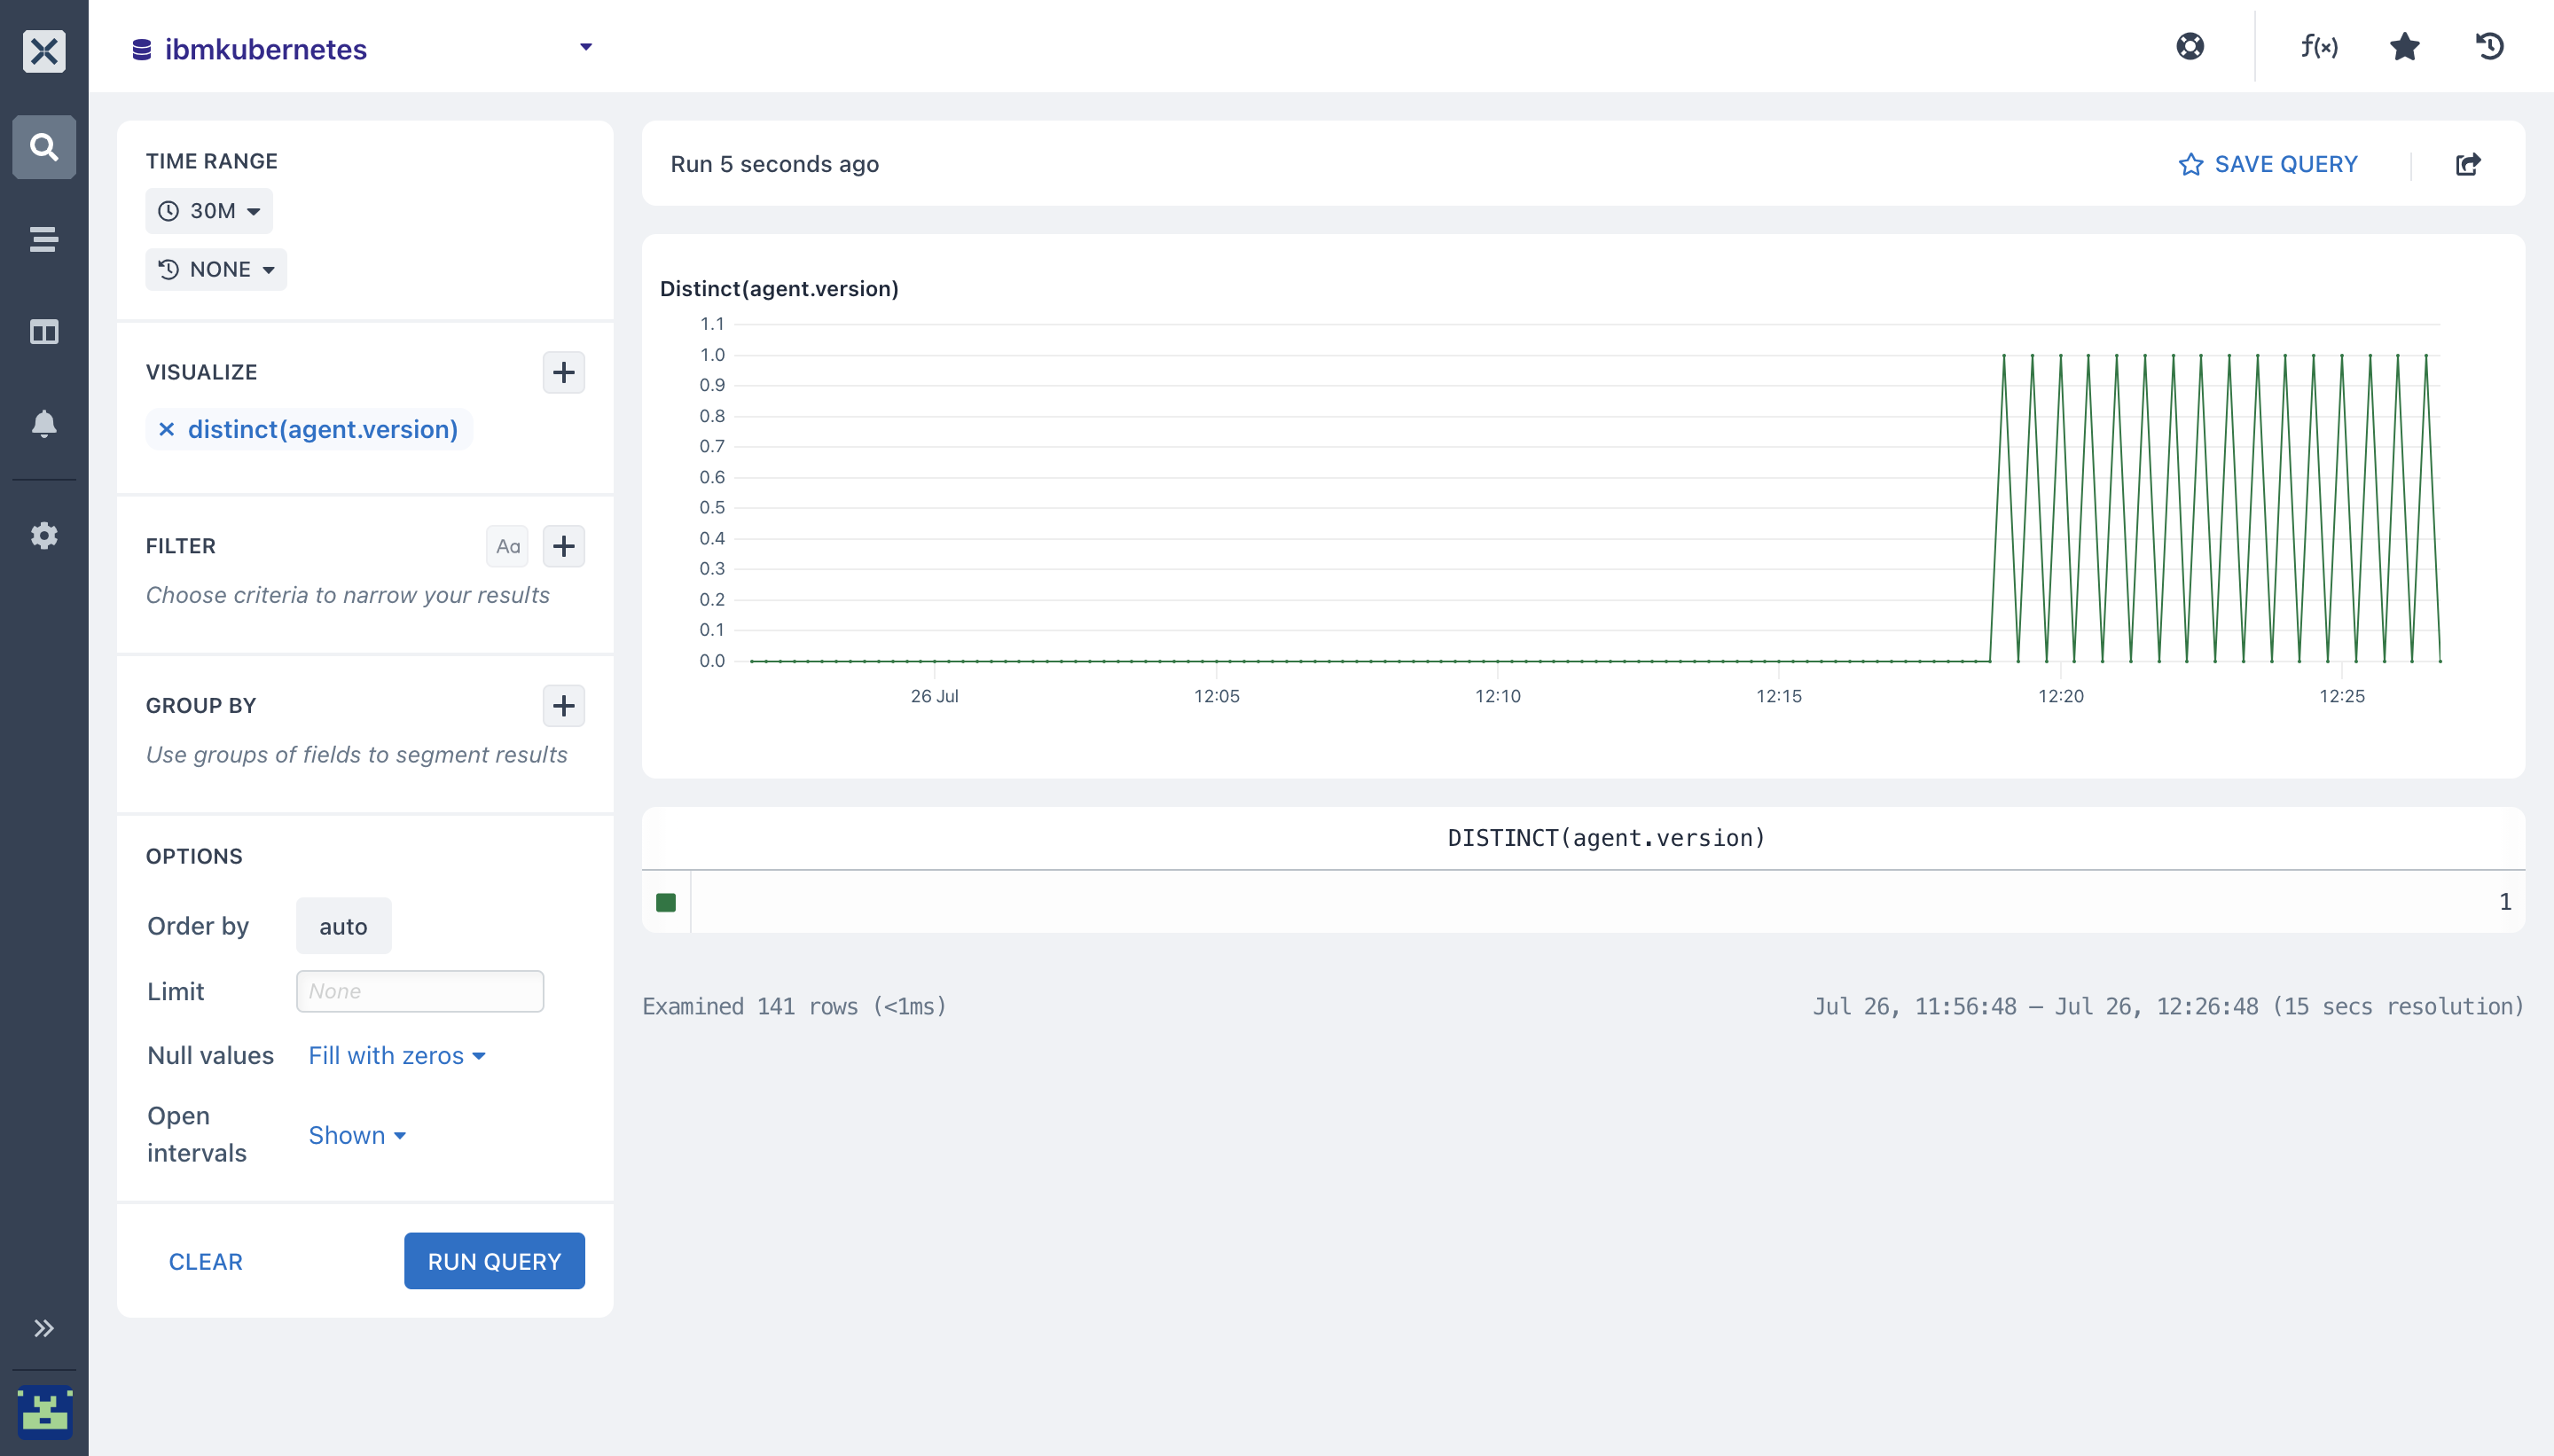
The table beneath the chart shows the total number of distinct values for the entire time period selected.
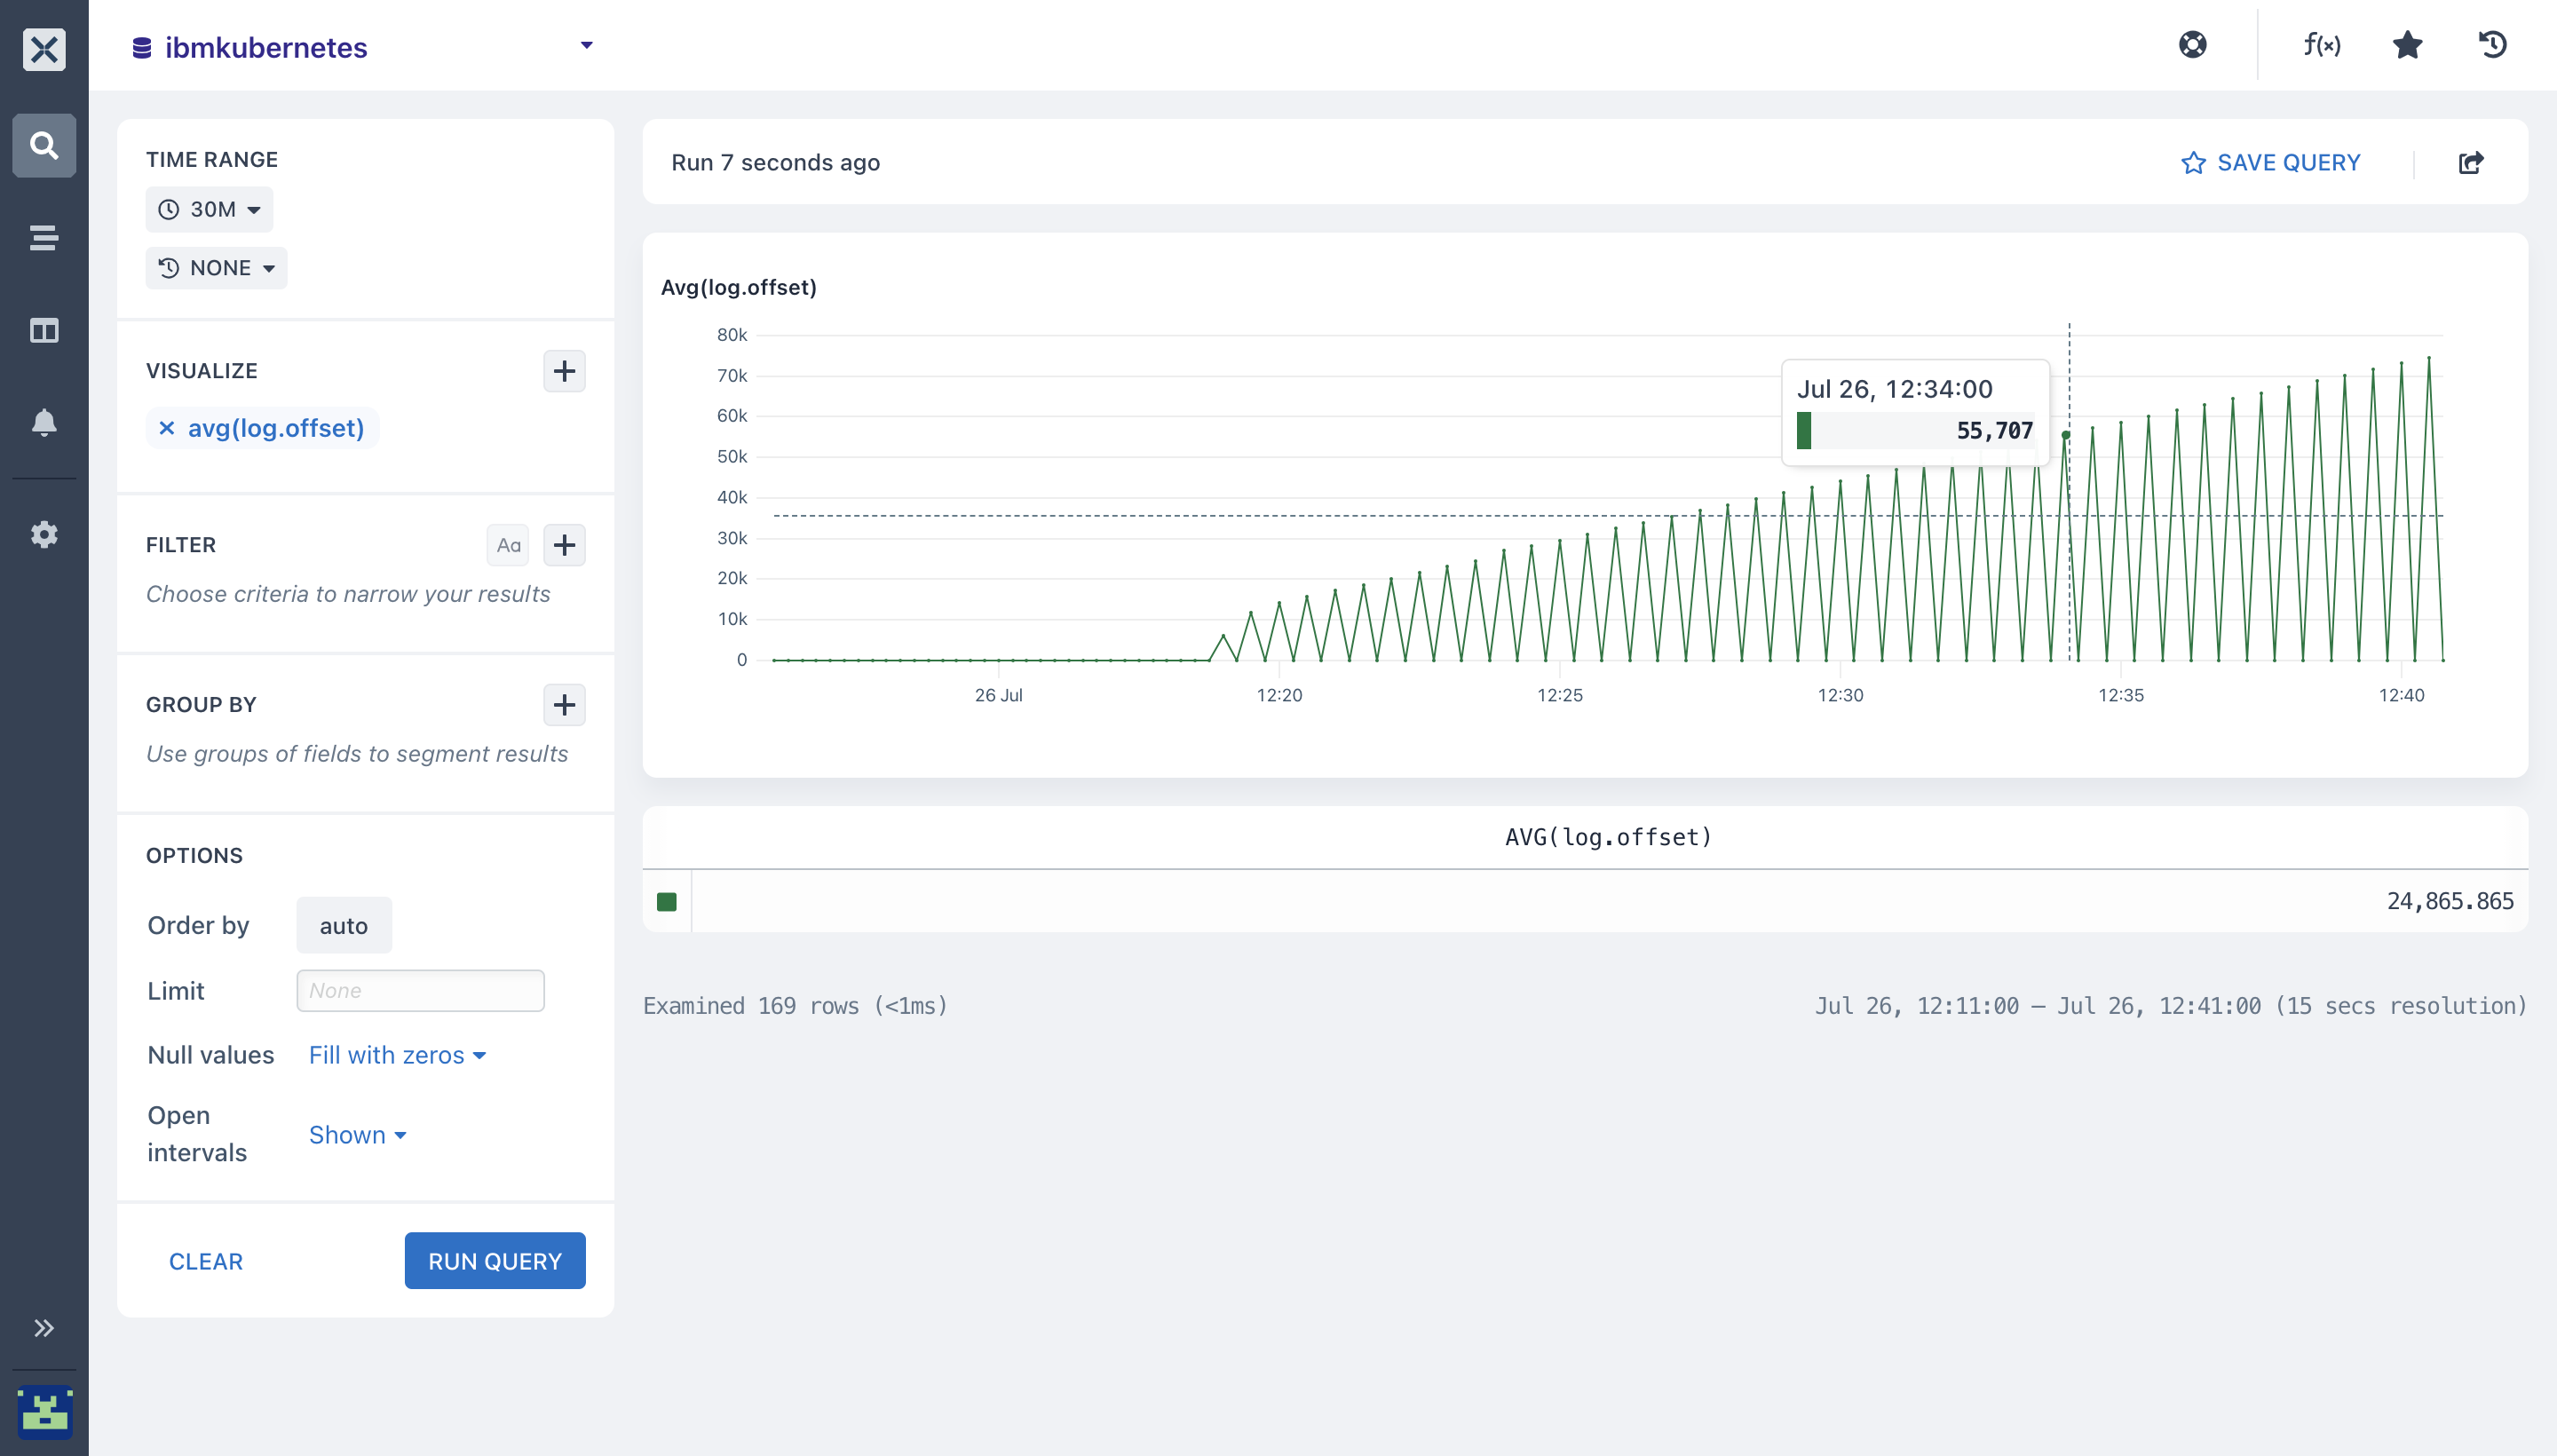
- average (): You can calculate the mean value for a numeric field in each time duration on your
ibmkubernetesdataset. Below is the overall average across the entire time period of the query selected.
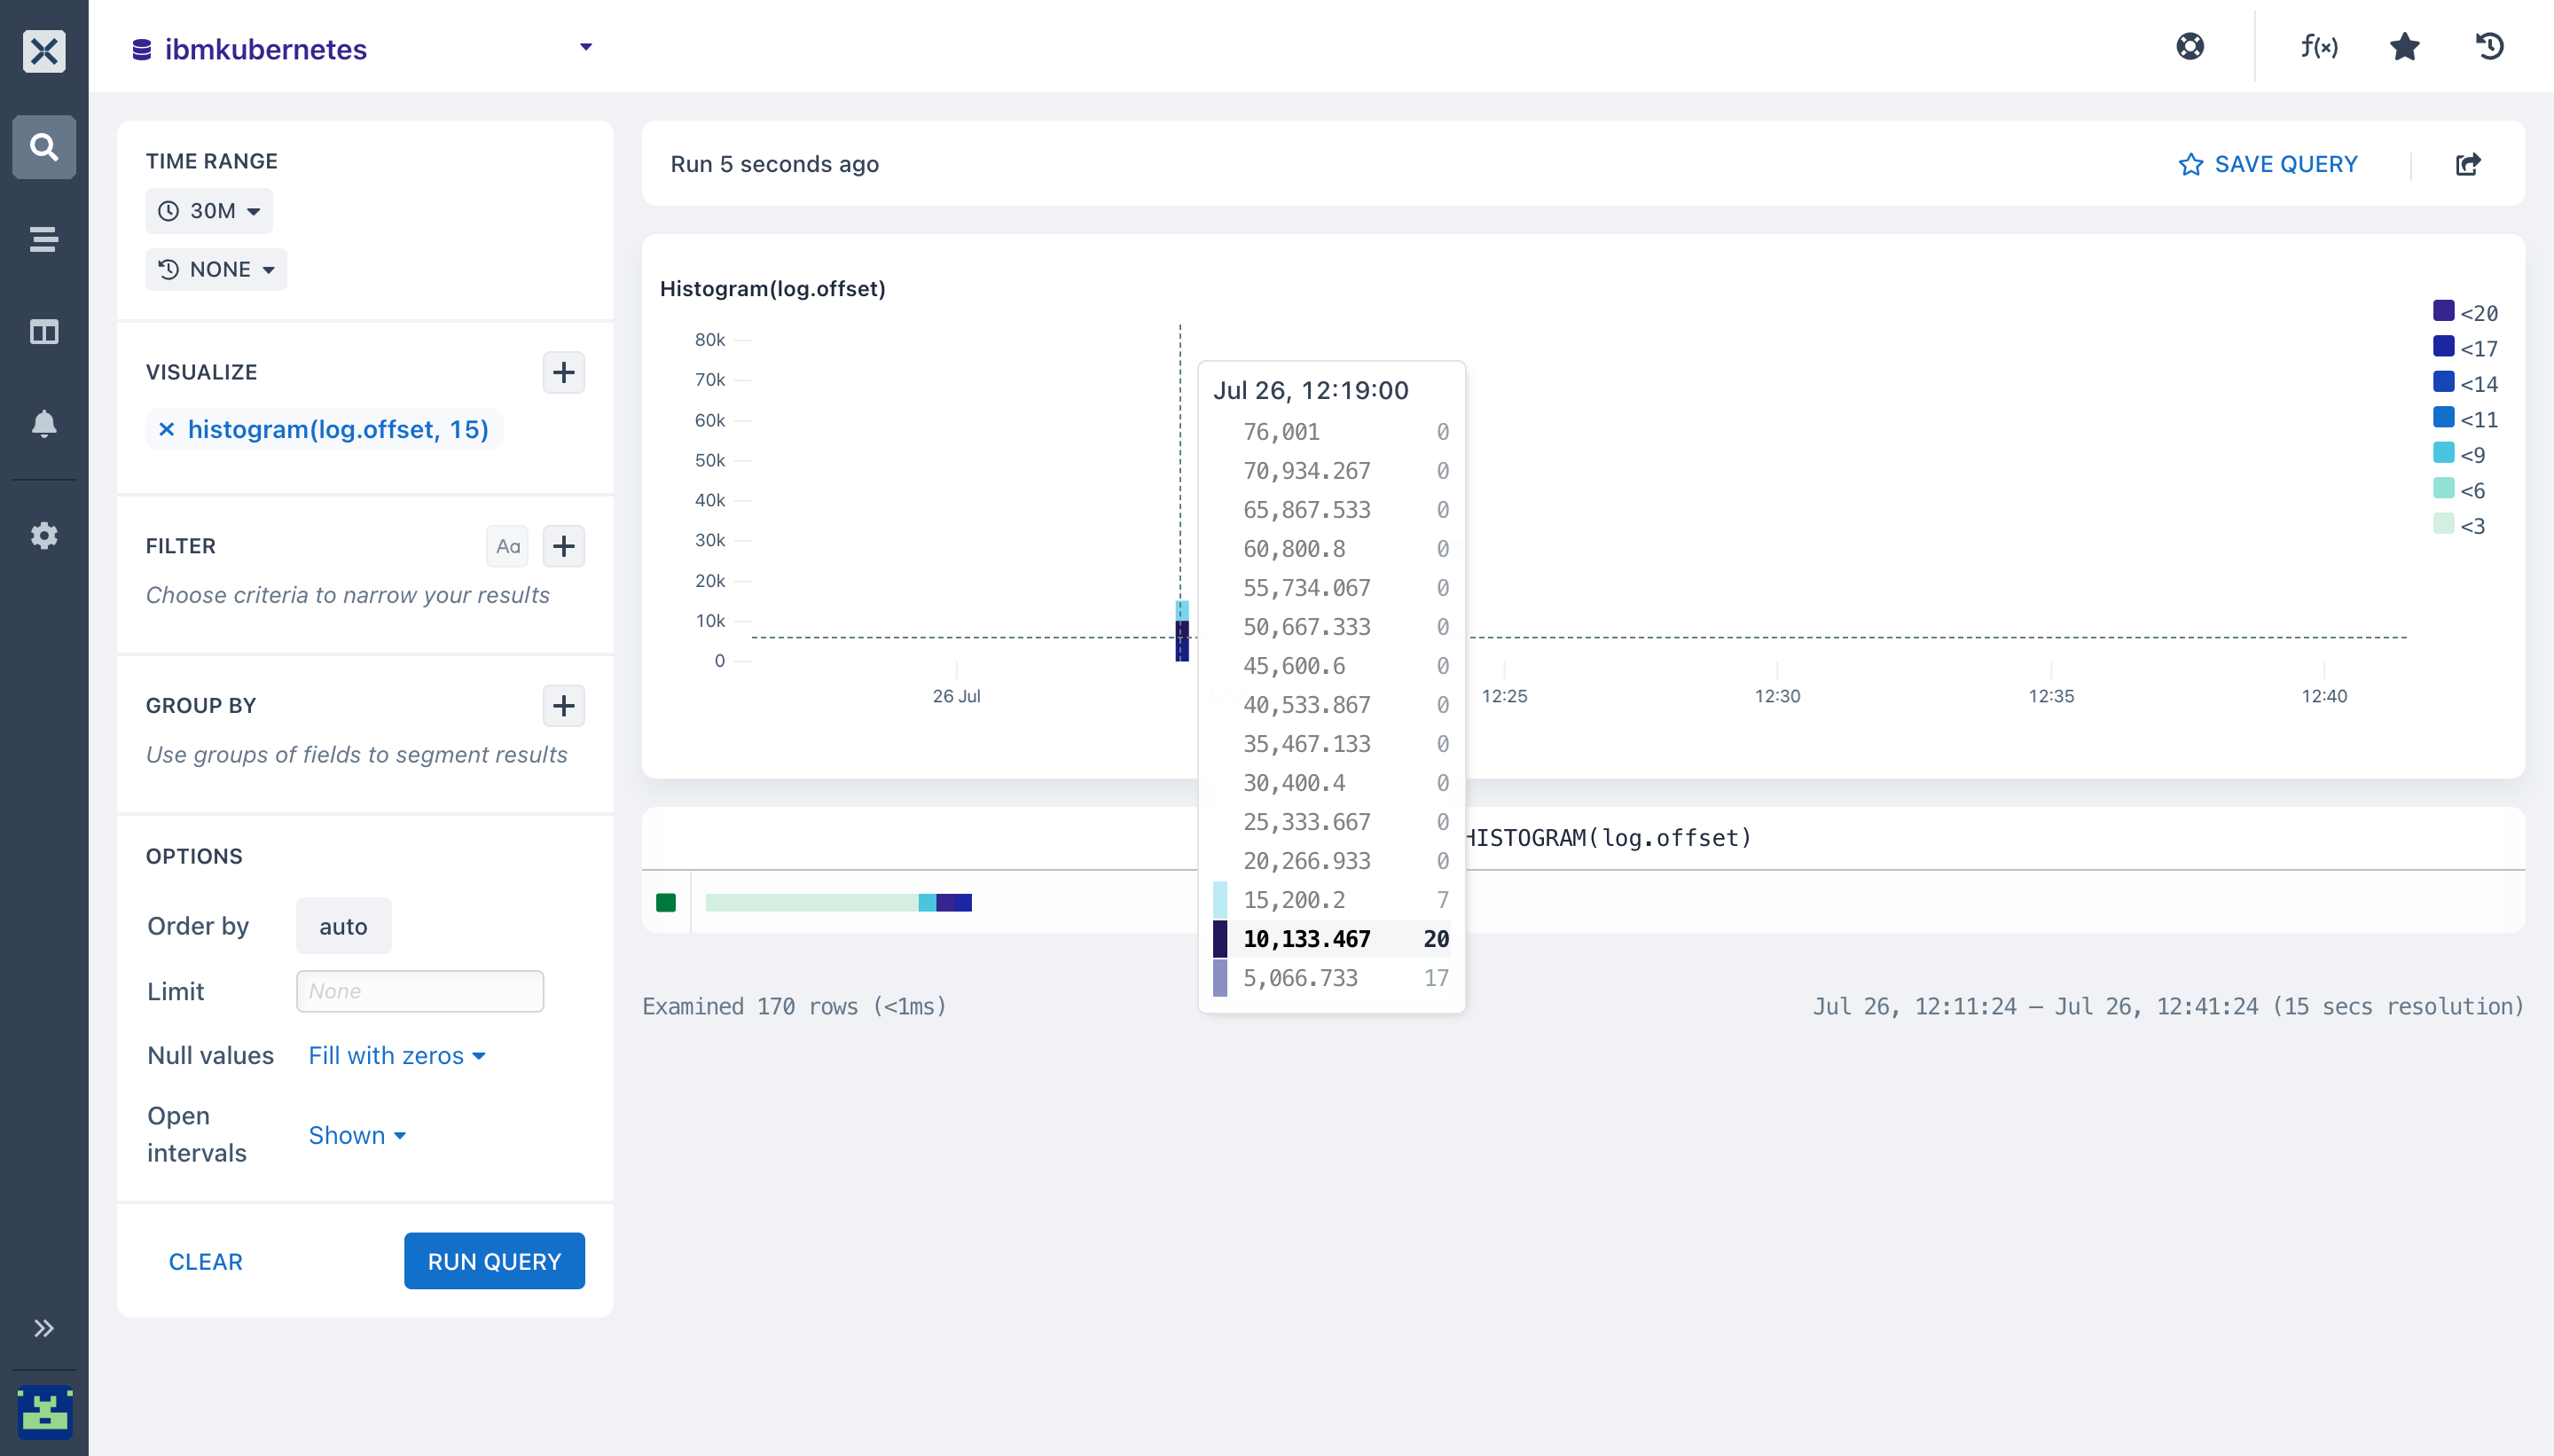
- histogram (): With the Histogram aggregation, you can get the distribution values in a field across a particular time range of your query. The histogram aggregation produces a boxplot that makes it very easy for you to see variations and know how your data is being distributed
The Histogram aggregation takes two arguments:
- The field you want to aggregate
- The number of buckets to split the values into (y-axis)
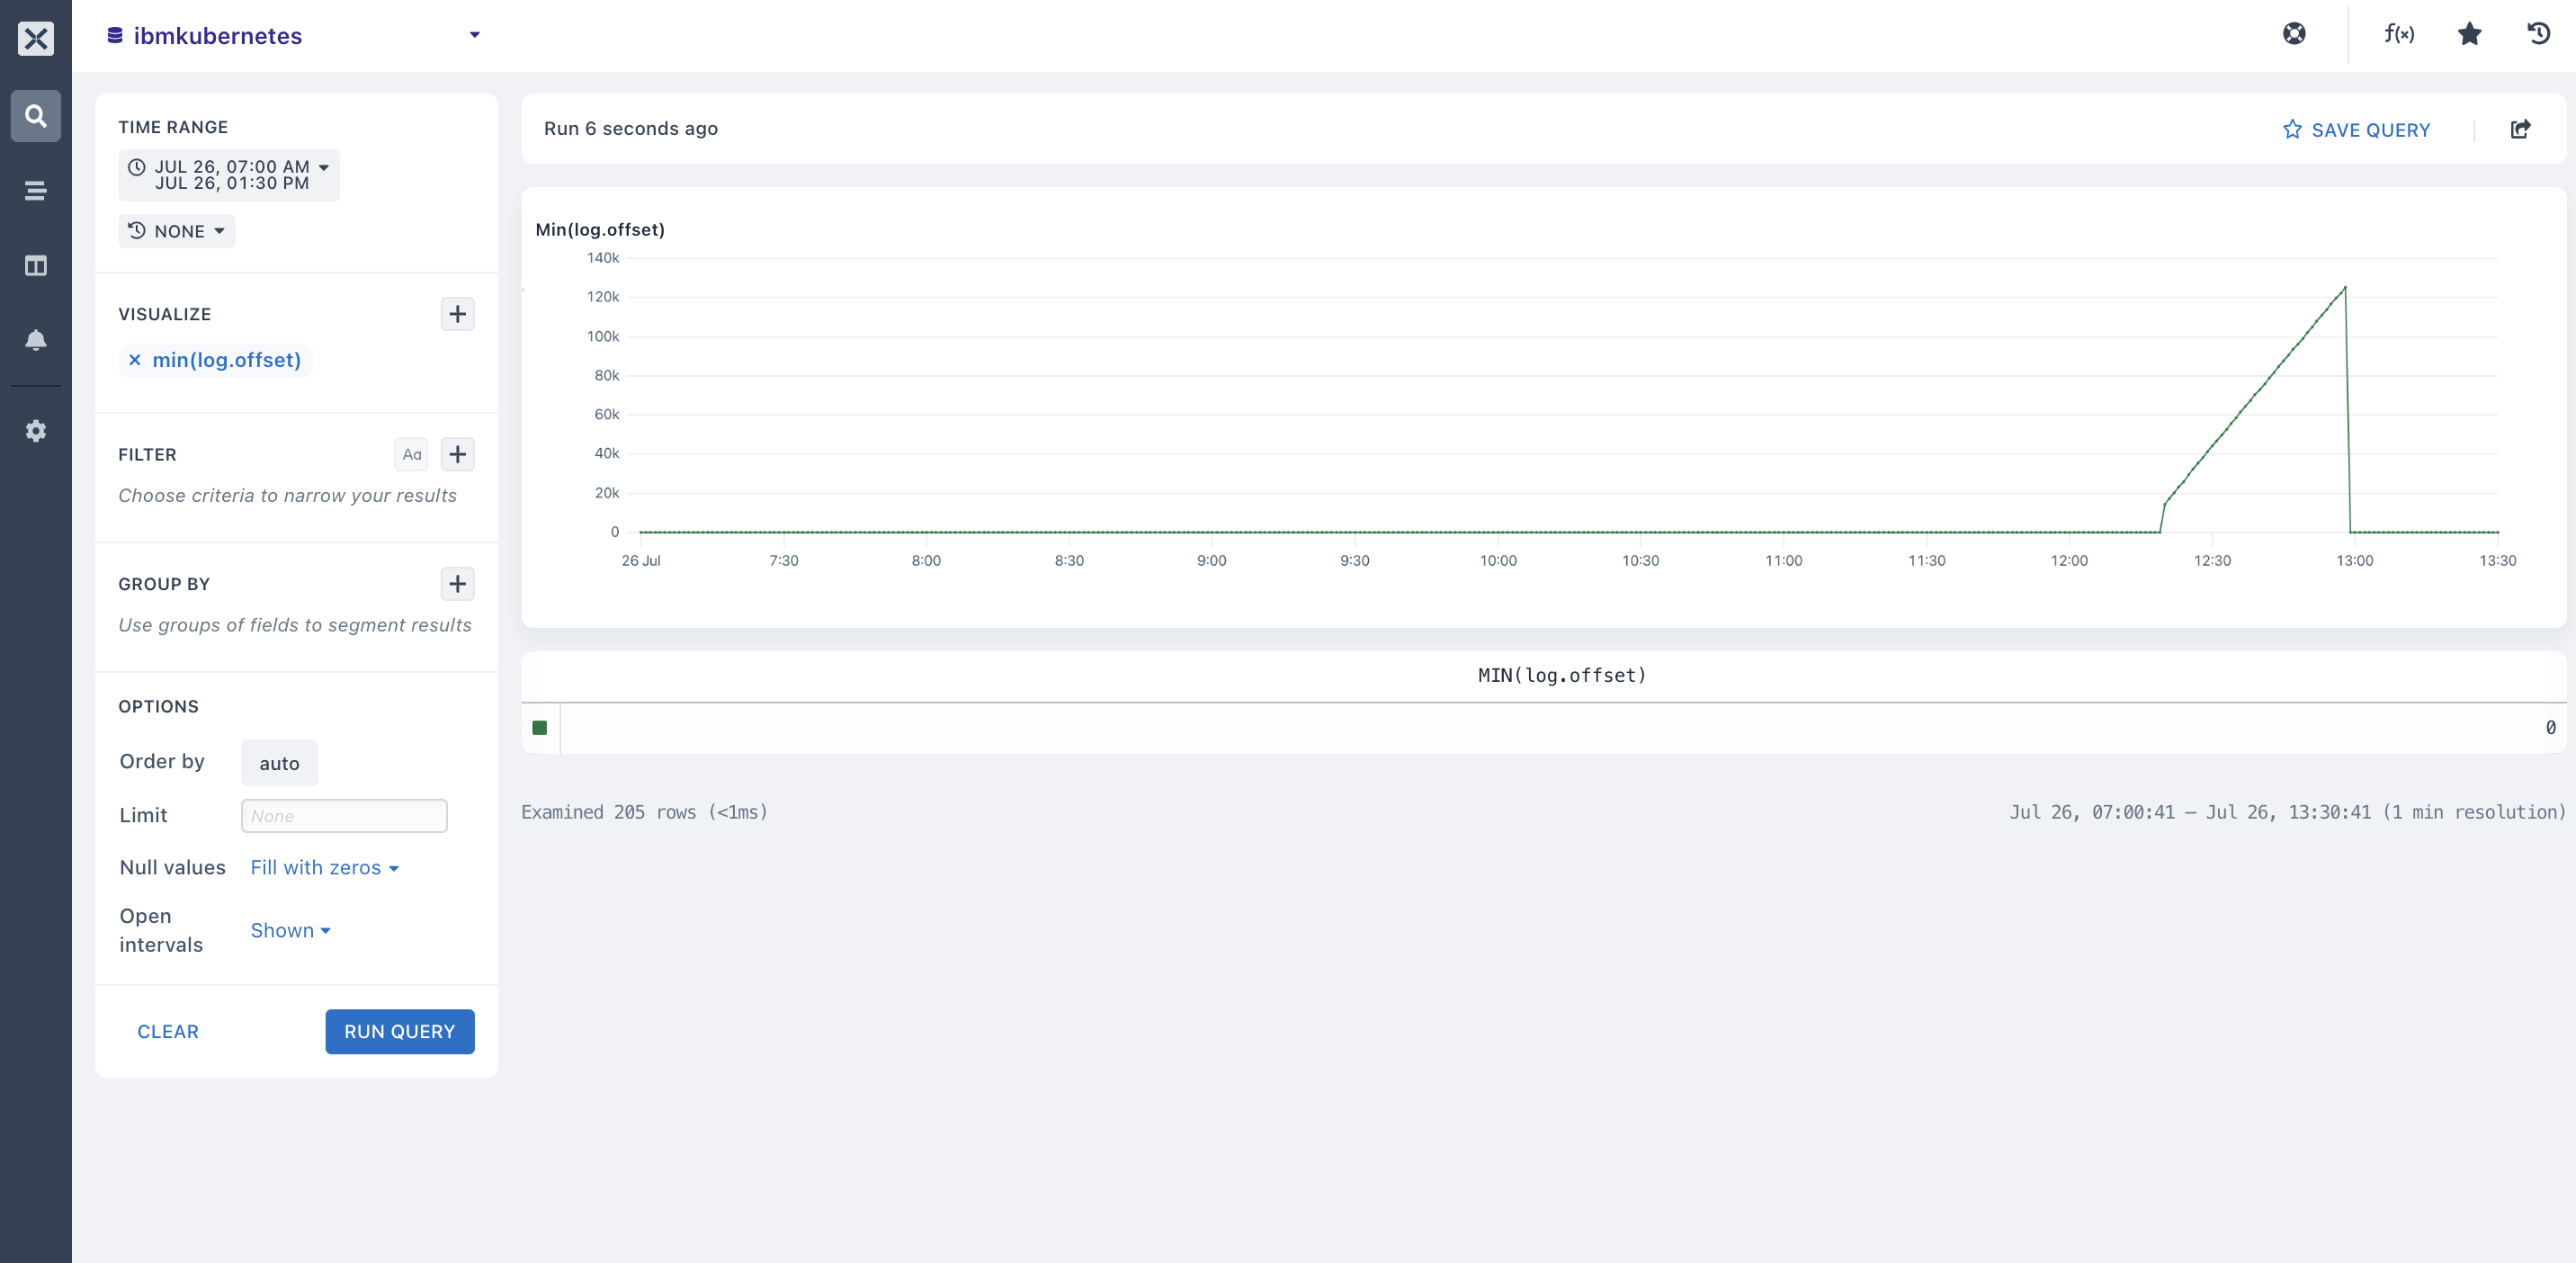
- minimum (): You can get the minimum value for a numeric field from your
ibmkubernetesdataset using this aggregation. When you have selected your field, it outputs a chart that contains the minimum value for each time duration in the table below the chart.
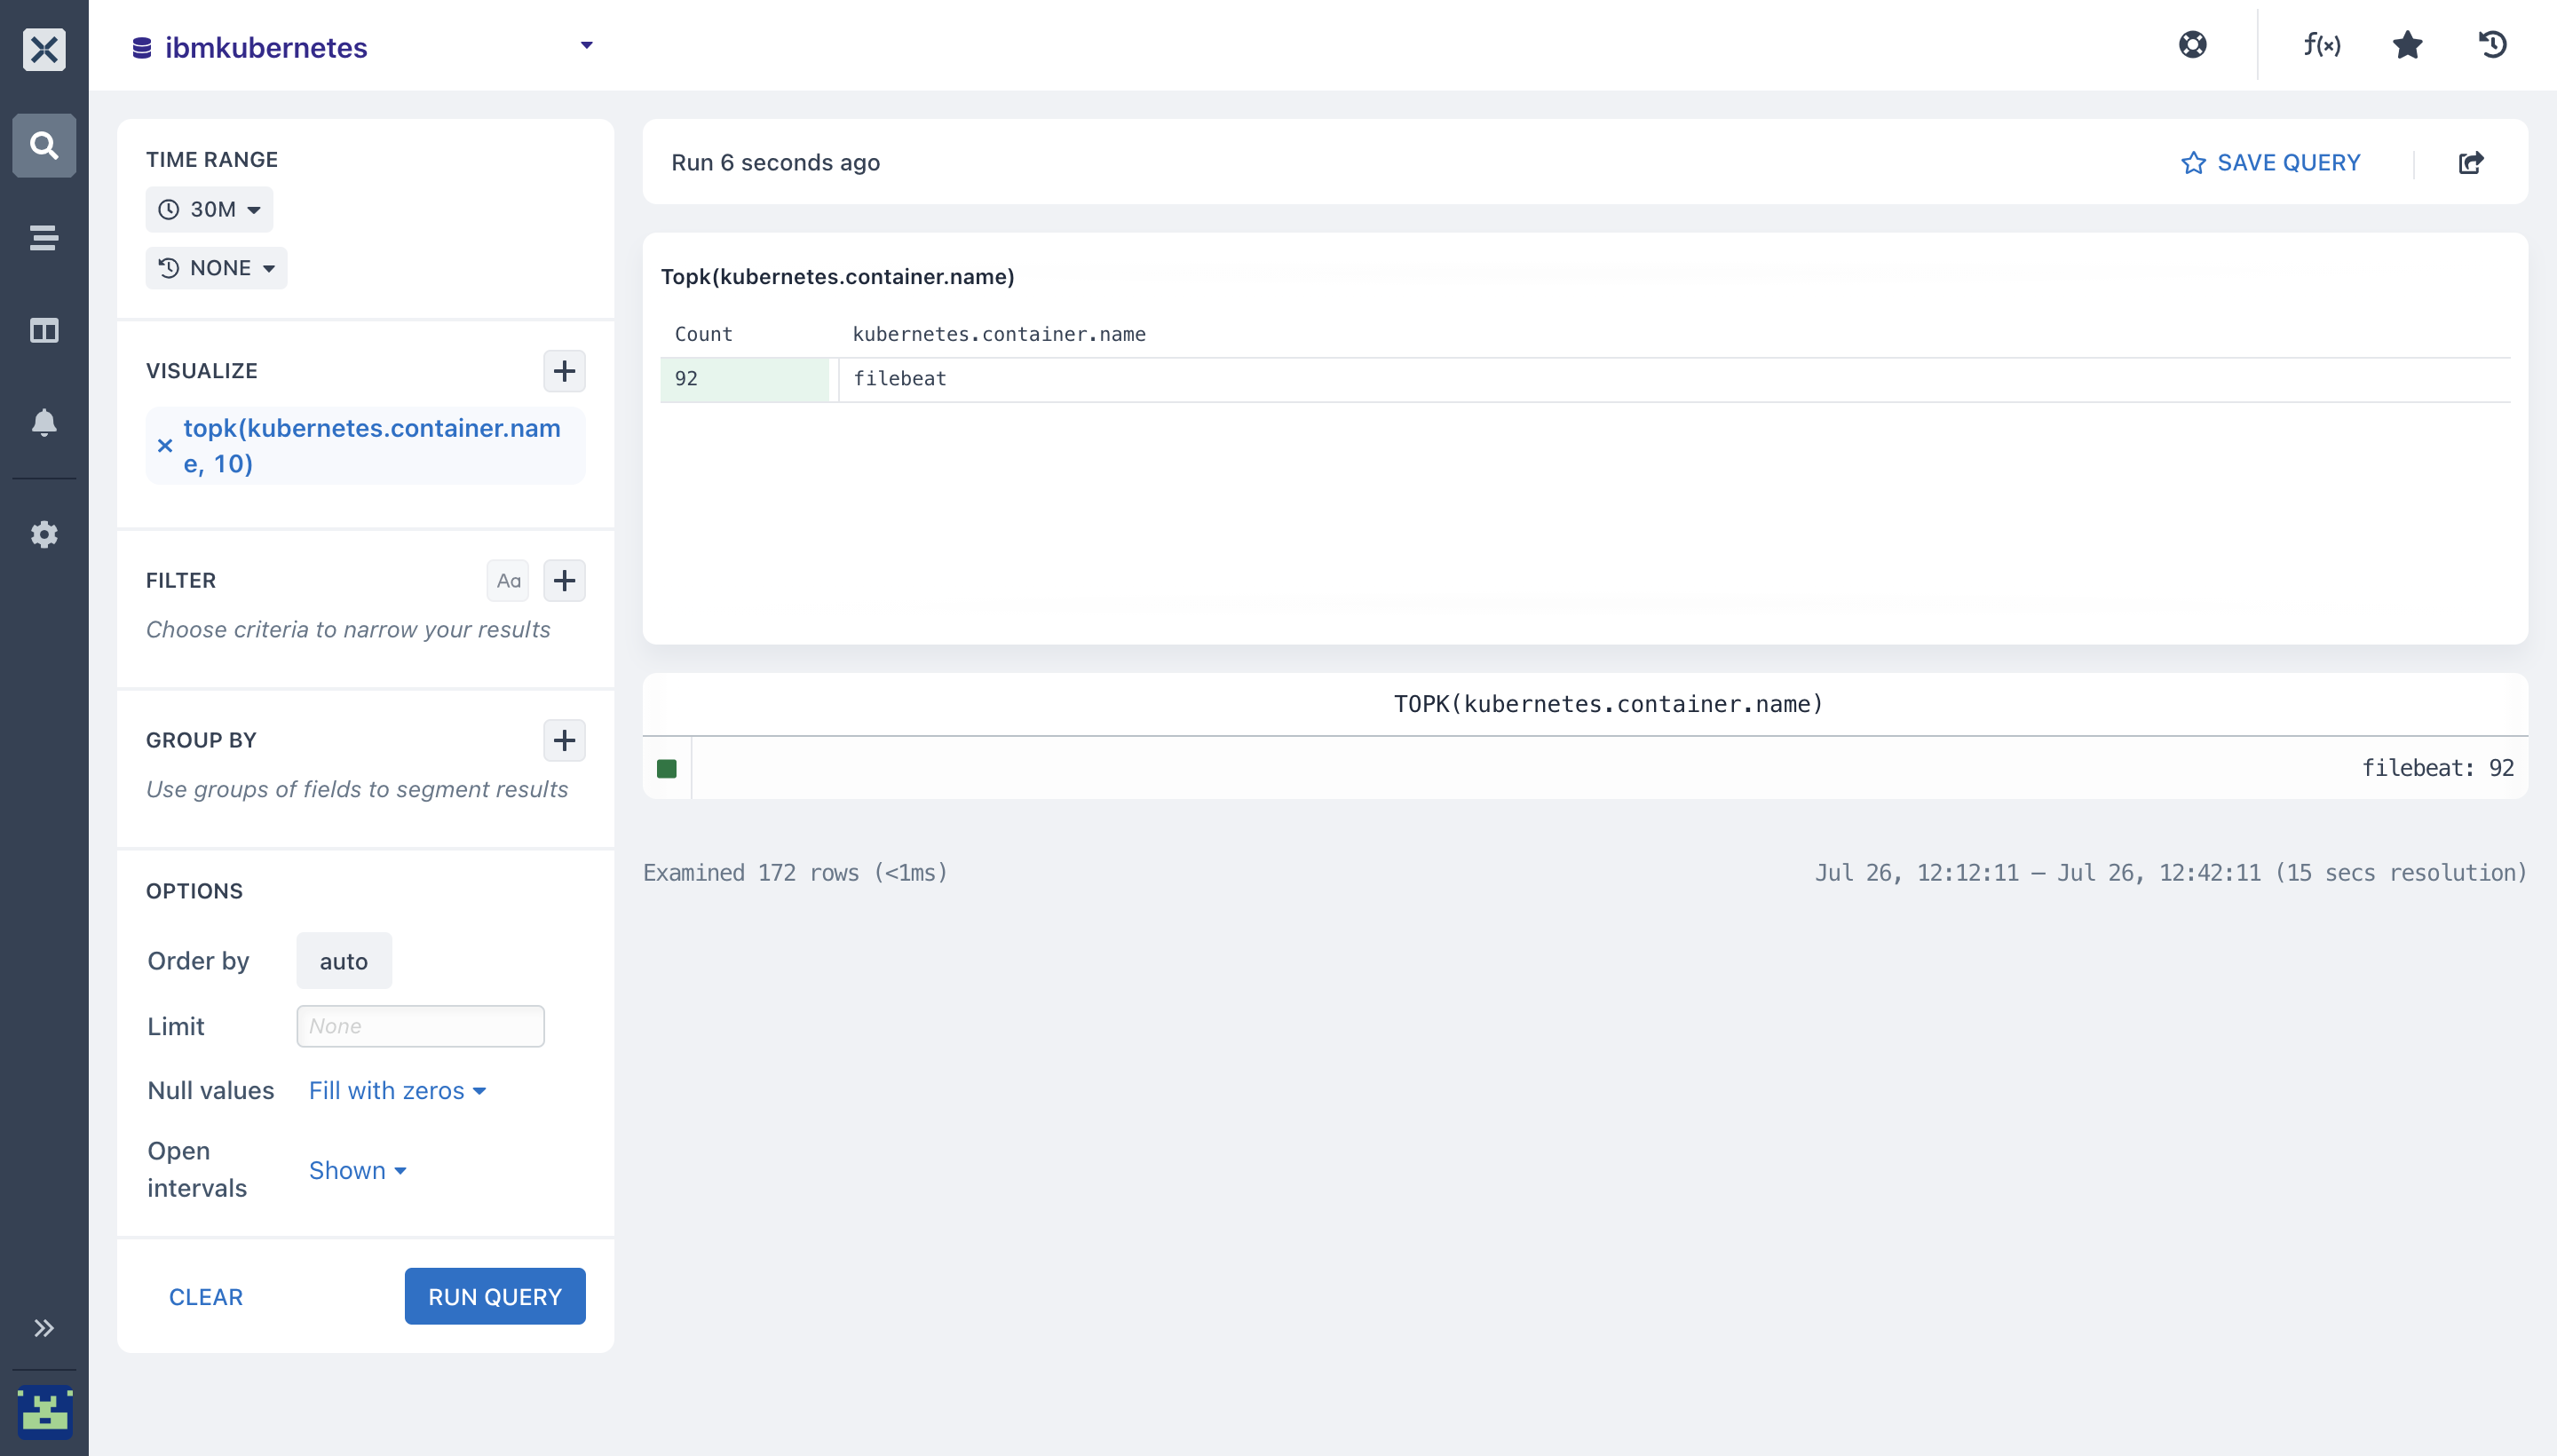
- topk(): You can use the topk aggregation to know the “top 4” or “top 10” (where ‘4’ and ’10’ are ‘k’ in the topk) values for a field(s) in your
ibmkubernetesdataset. Before you can use the topk aggregation it takes two arguments: The field to aggregate and how many results to return. Here, we want to get thetop 10values from the[kubernetes.container.name](http://kubernetes.container.name)field.
- Pairing Aggregations with Group By: Many of the aggregations above can be paired with a
Group By clausein your query to segment your data. This will give you a comprehensive view by pairing your aggregations above with the Group by expression in your query. This lets you segment your data and let you have a view of how each fraction of youribm Kubernetes logsis operating.
- Here, we ran the
max and percentileaggregations and paired them with theGroup by cluaseto get each segment from[kubernetes.container.name](http://kubernetes.container.name)andkubernetes.pods.name
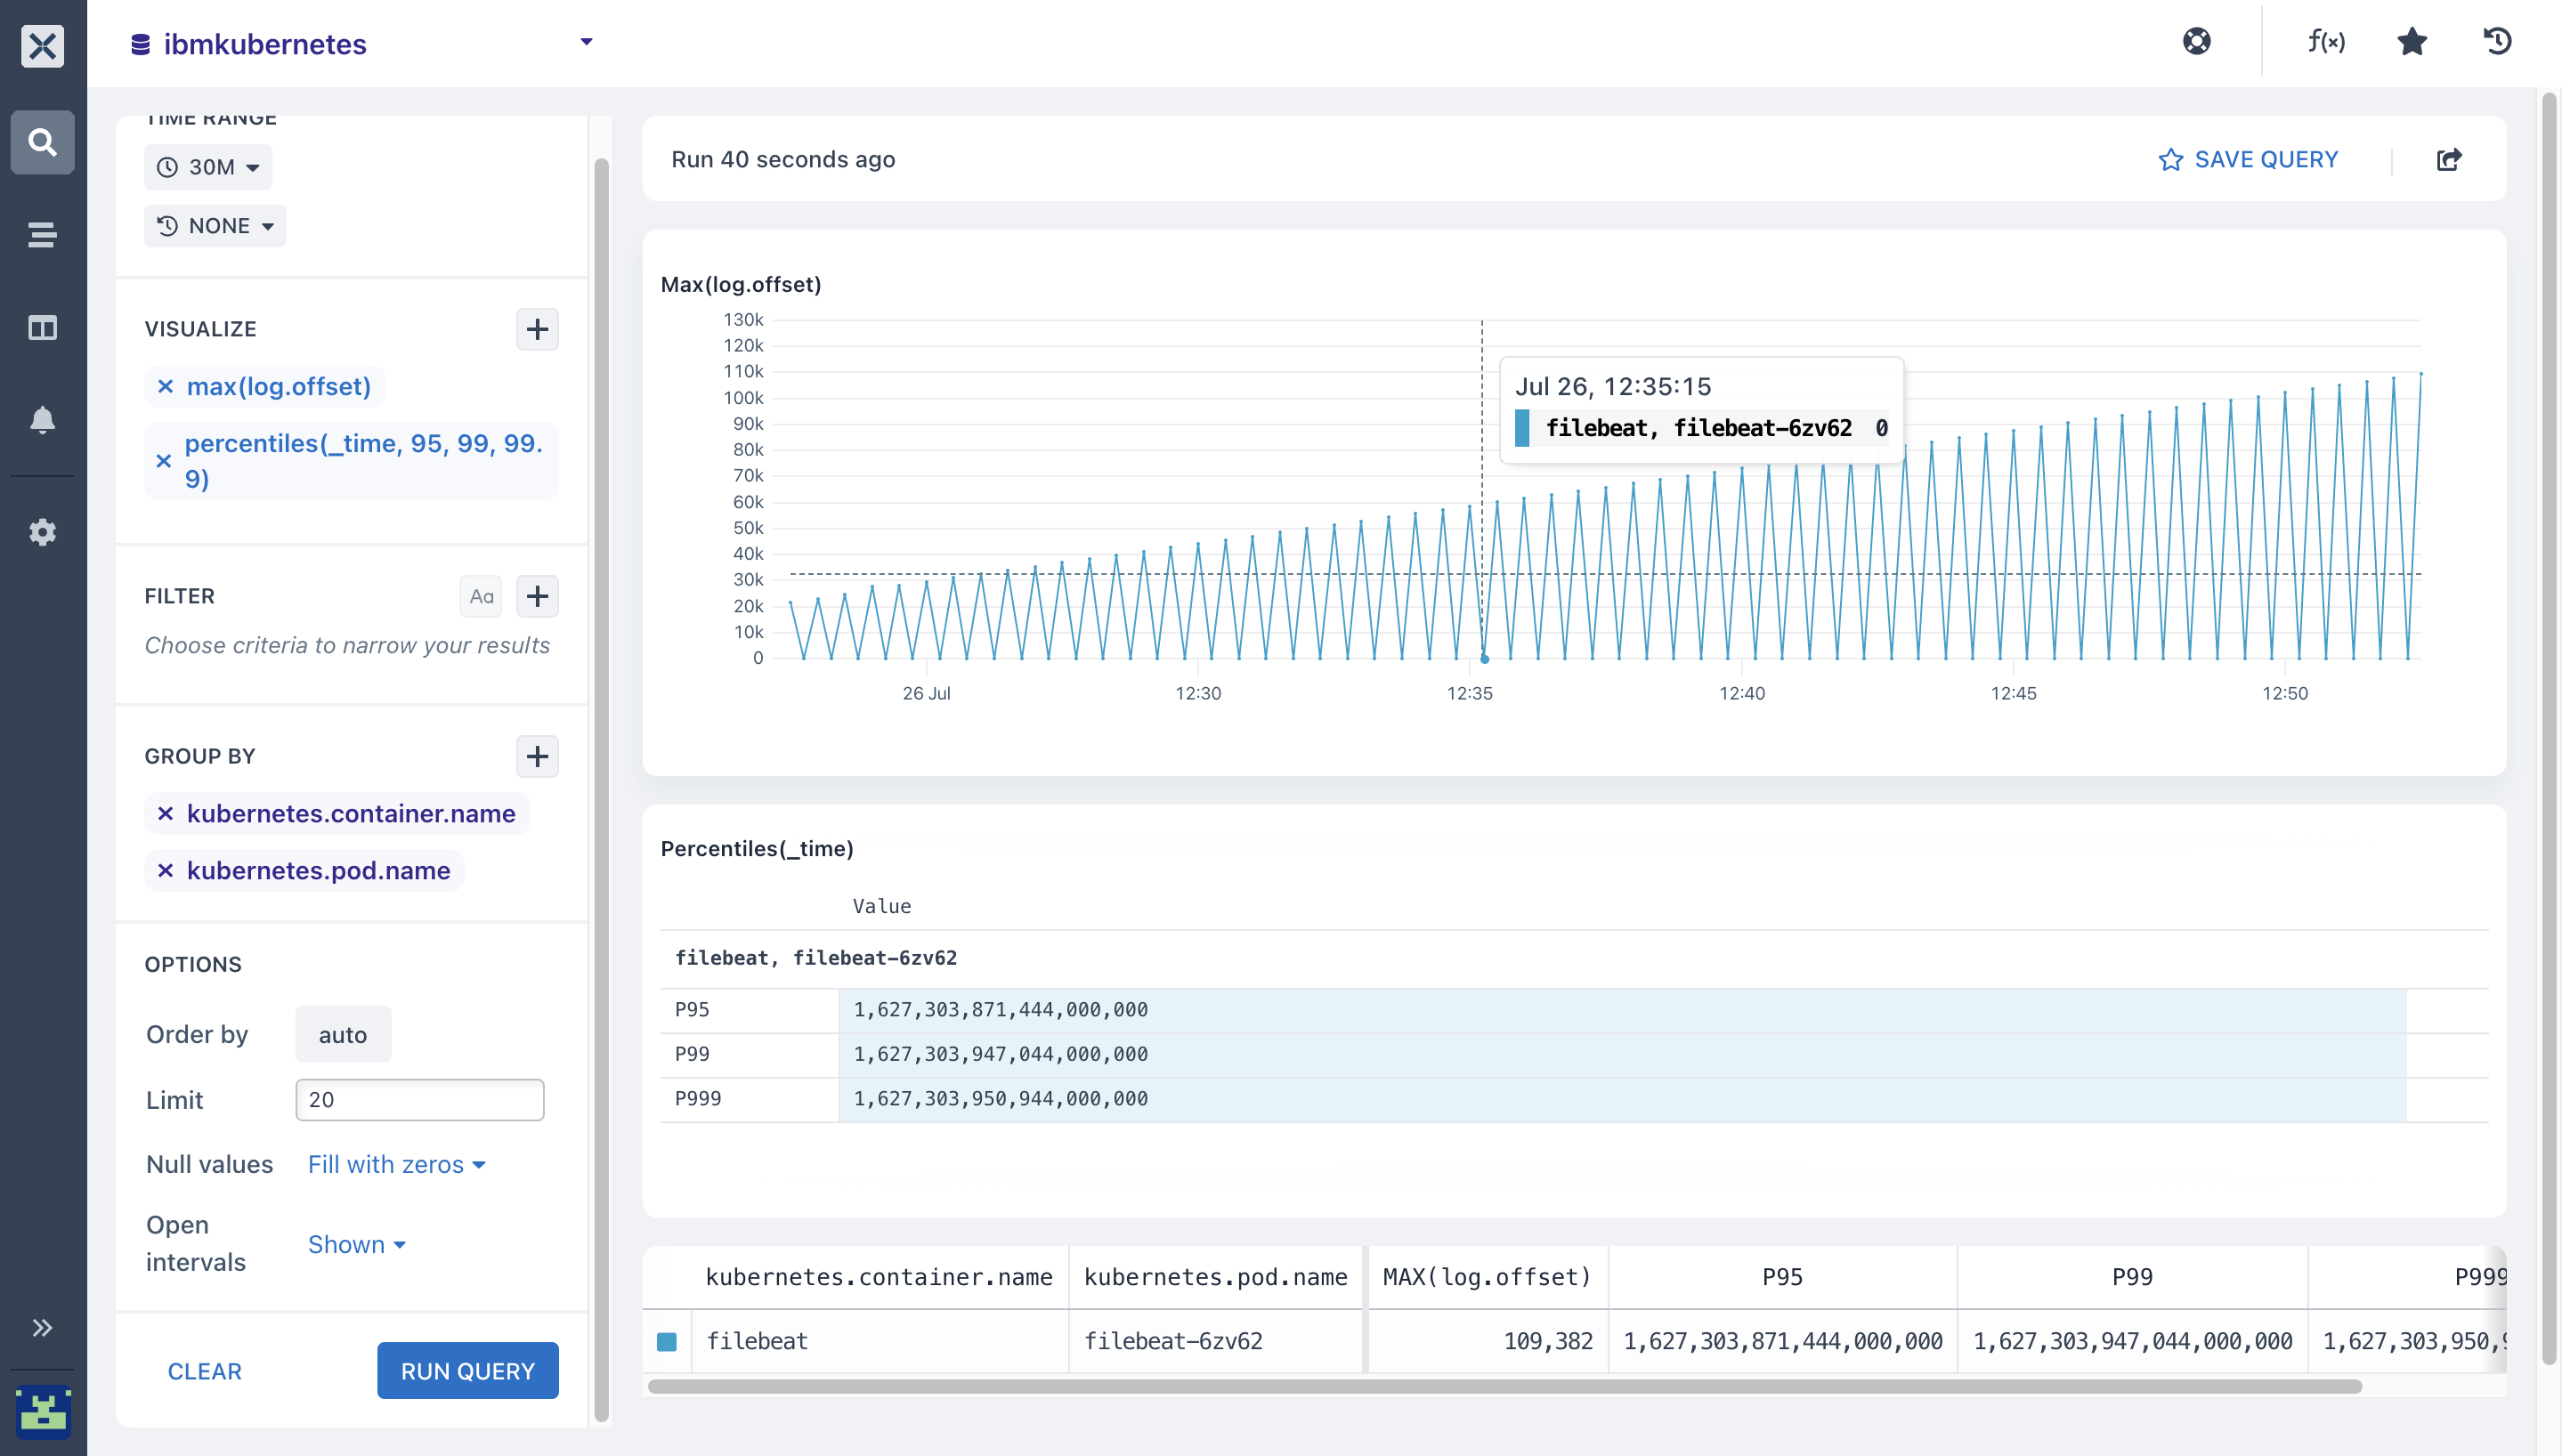
- Adding and paring more aggregations with
Group By
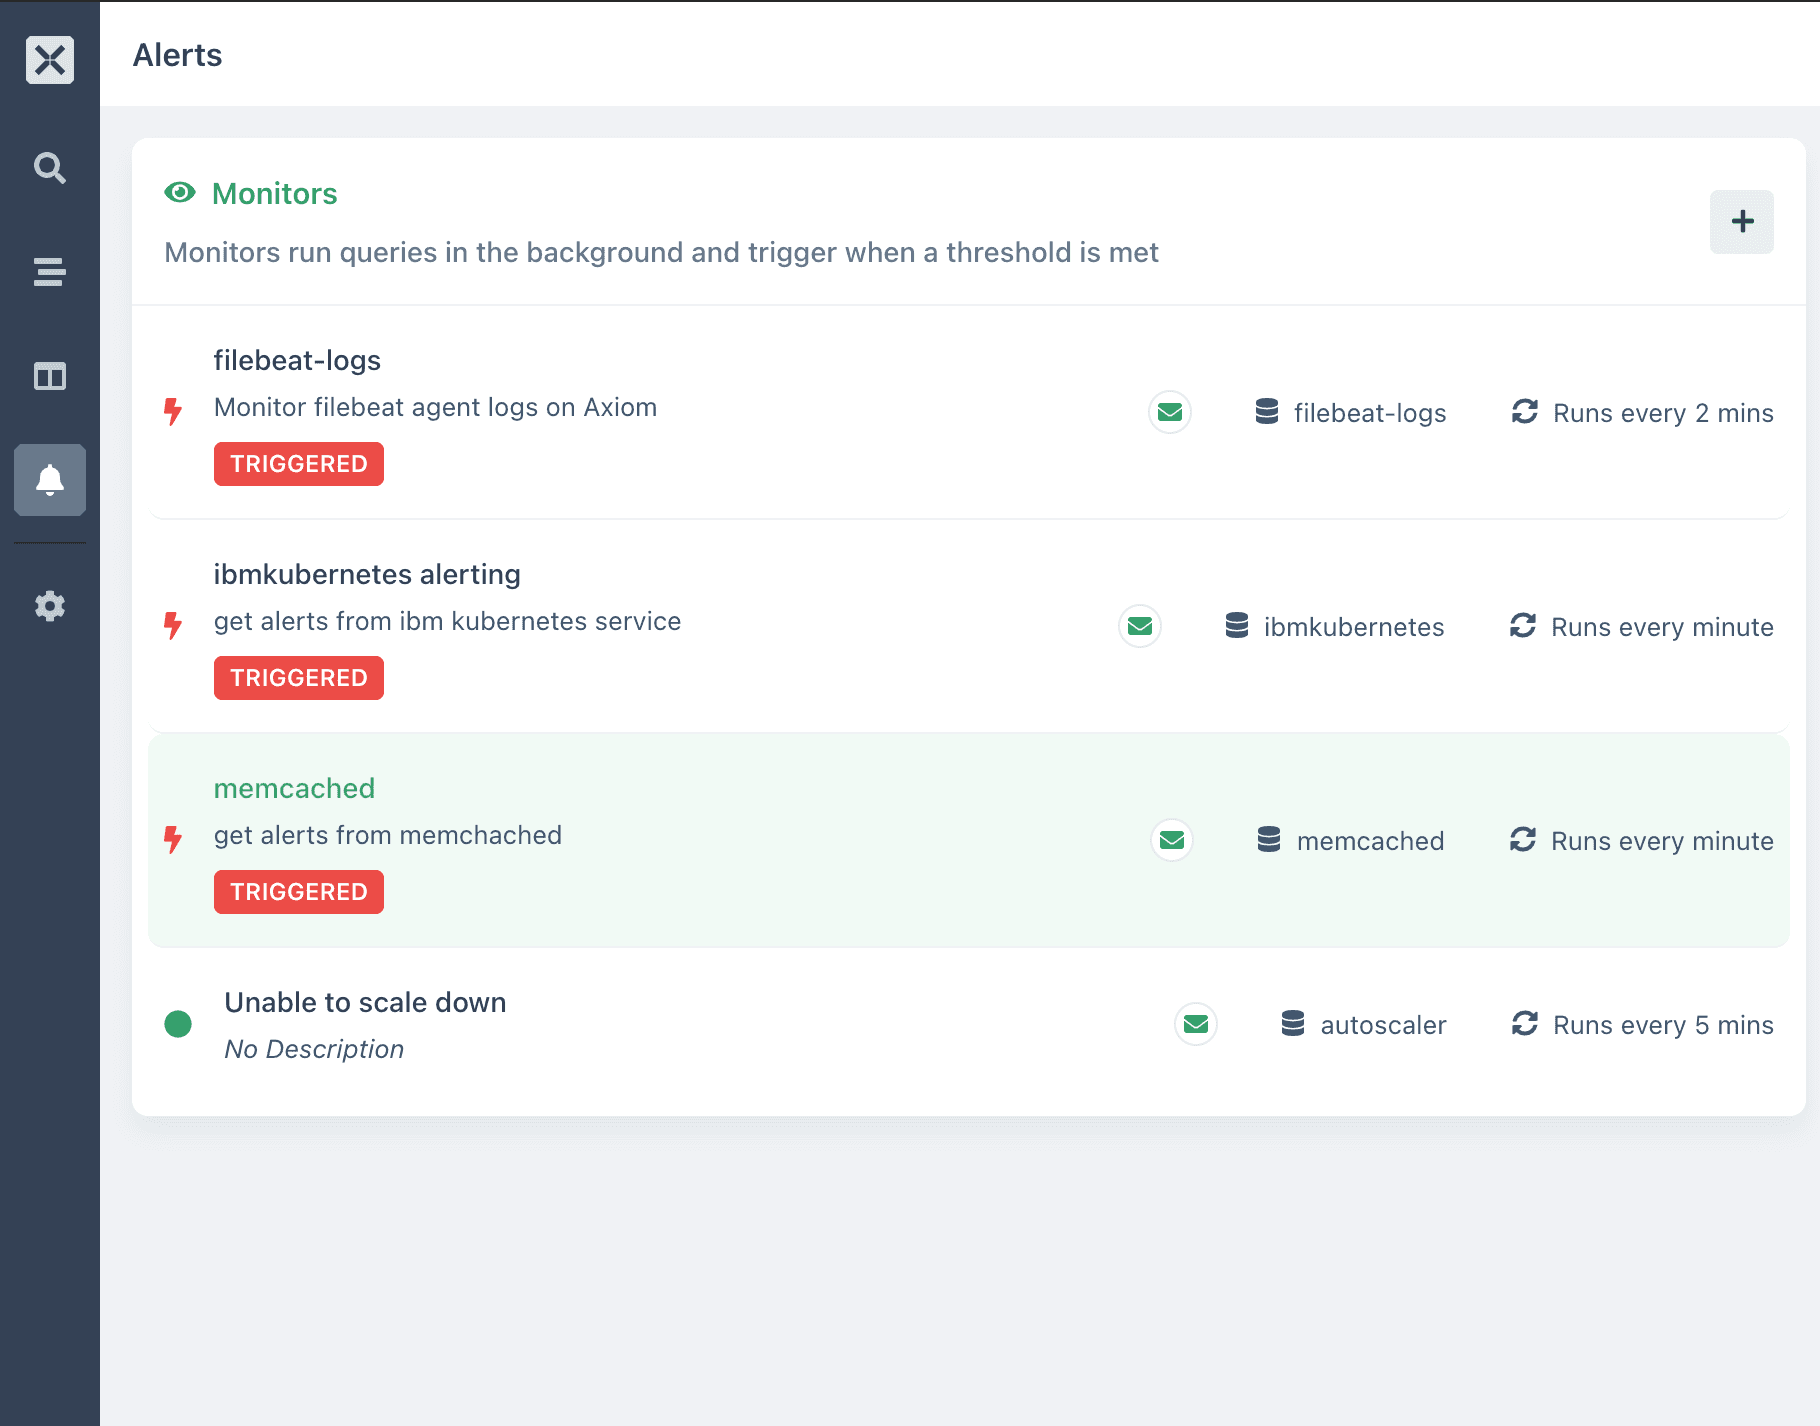
- After running queries to get different visualizations, you can set up monitors to get alerts when your
pod state,node logs,pod nameor[container.name](http://container.name)changes status due to one condition or the other.
- With Axiom Notifiers and Monitors, your team will be aware of spikes in Kubernetes traffics, pod downtime, events downtime, namespace tracking, destination type, events interruption, and if any abnormalities arise.
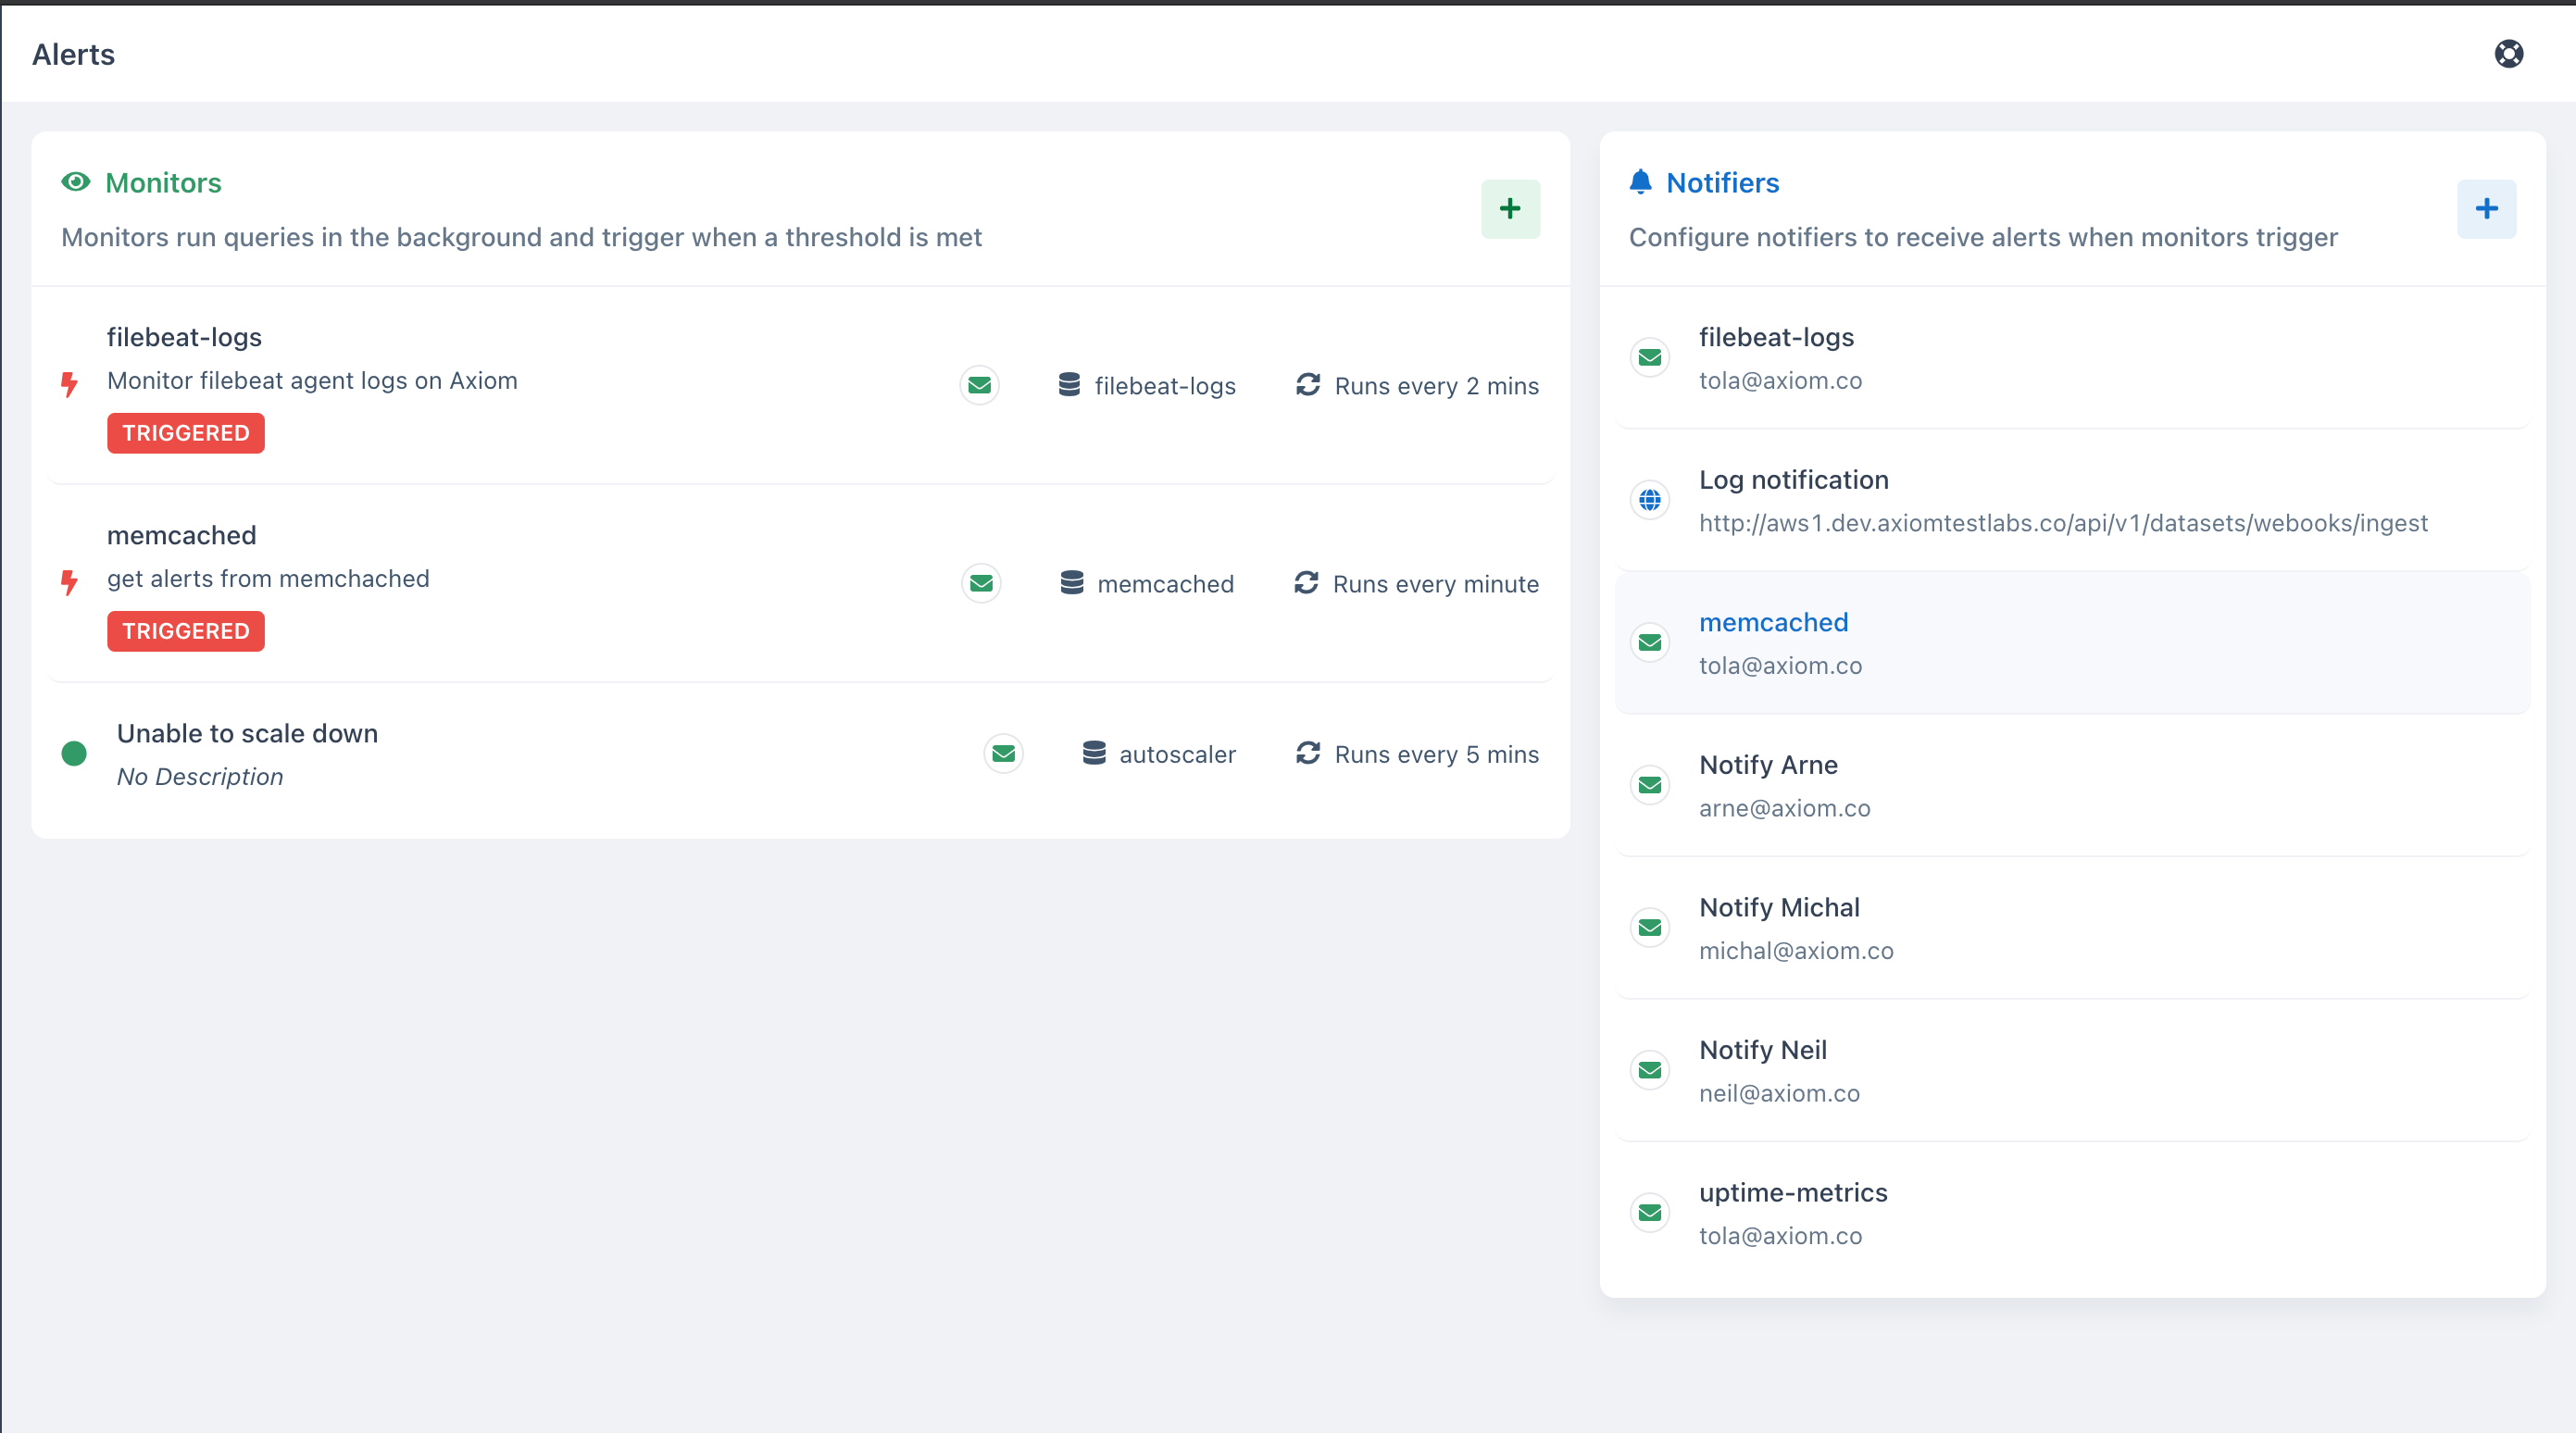
Notifications can be sent through four different Notifiers:
- Slack
- PagerDuty
- Webhook
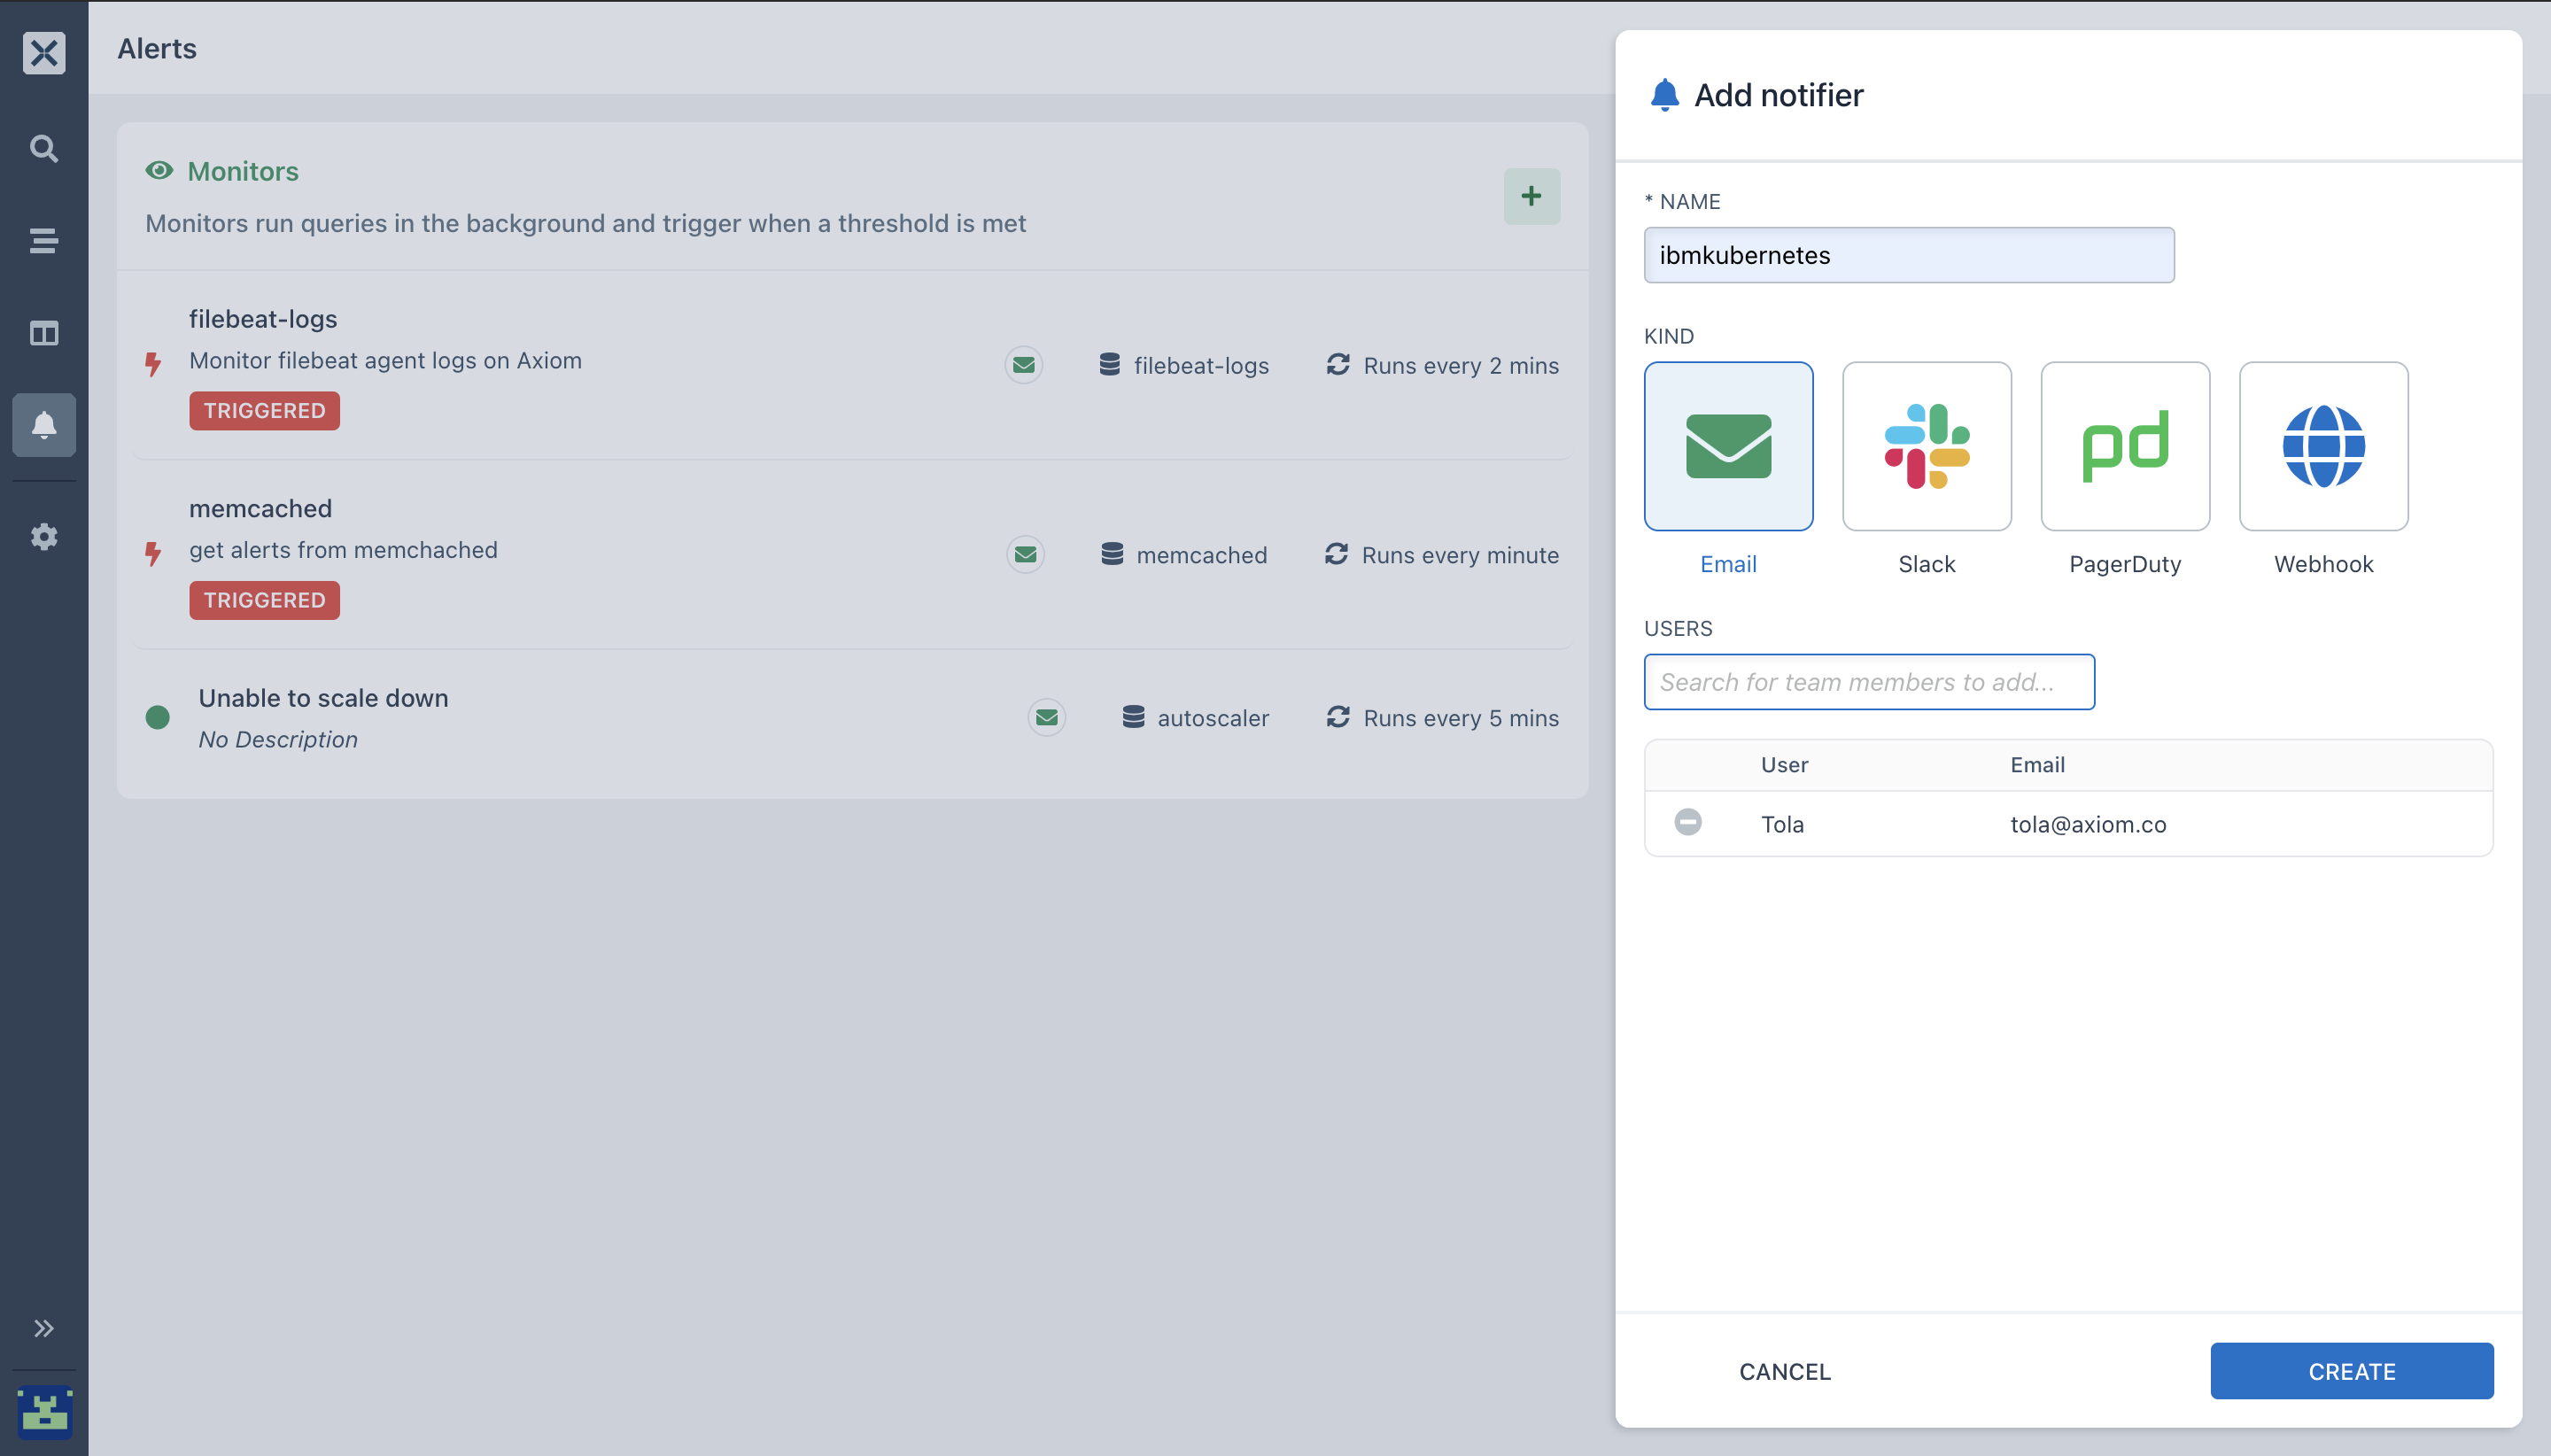
- Select the specific notifier you would like to use for your Monitor.
- Select the number of users you want to add to the notifier.
- Click on
CREATE
- After you have selected your Notifier, Configure your Monitor.
-
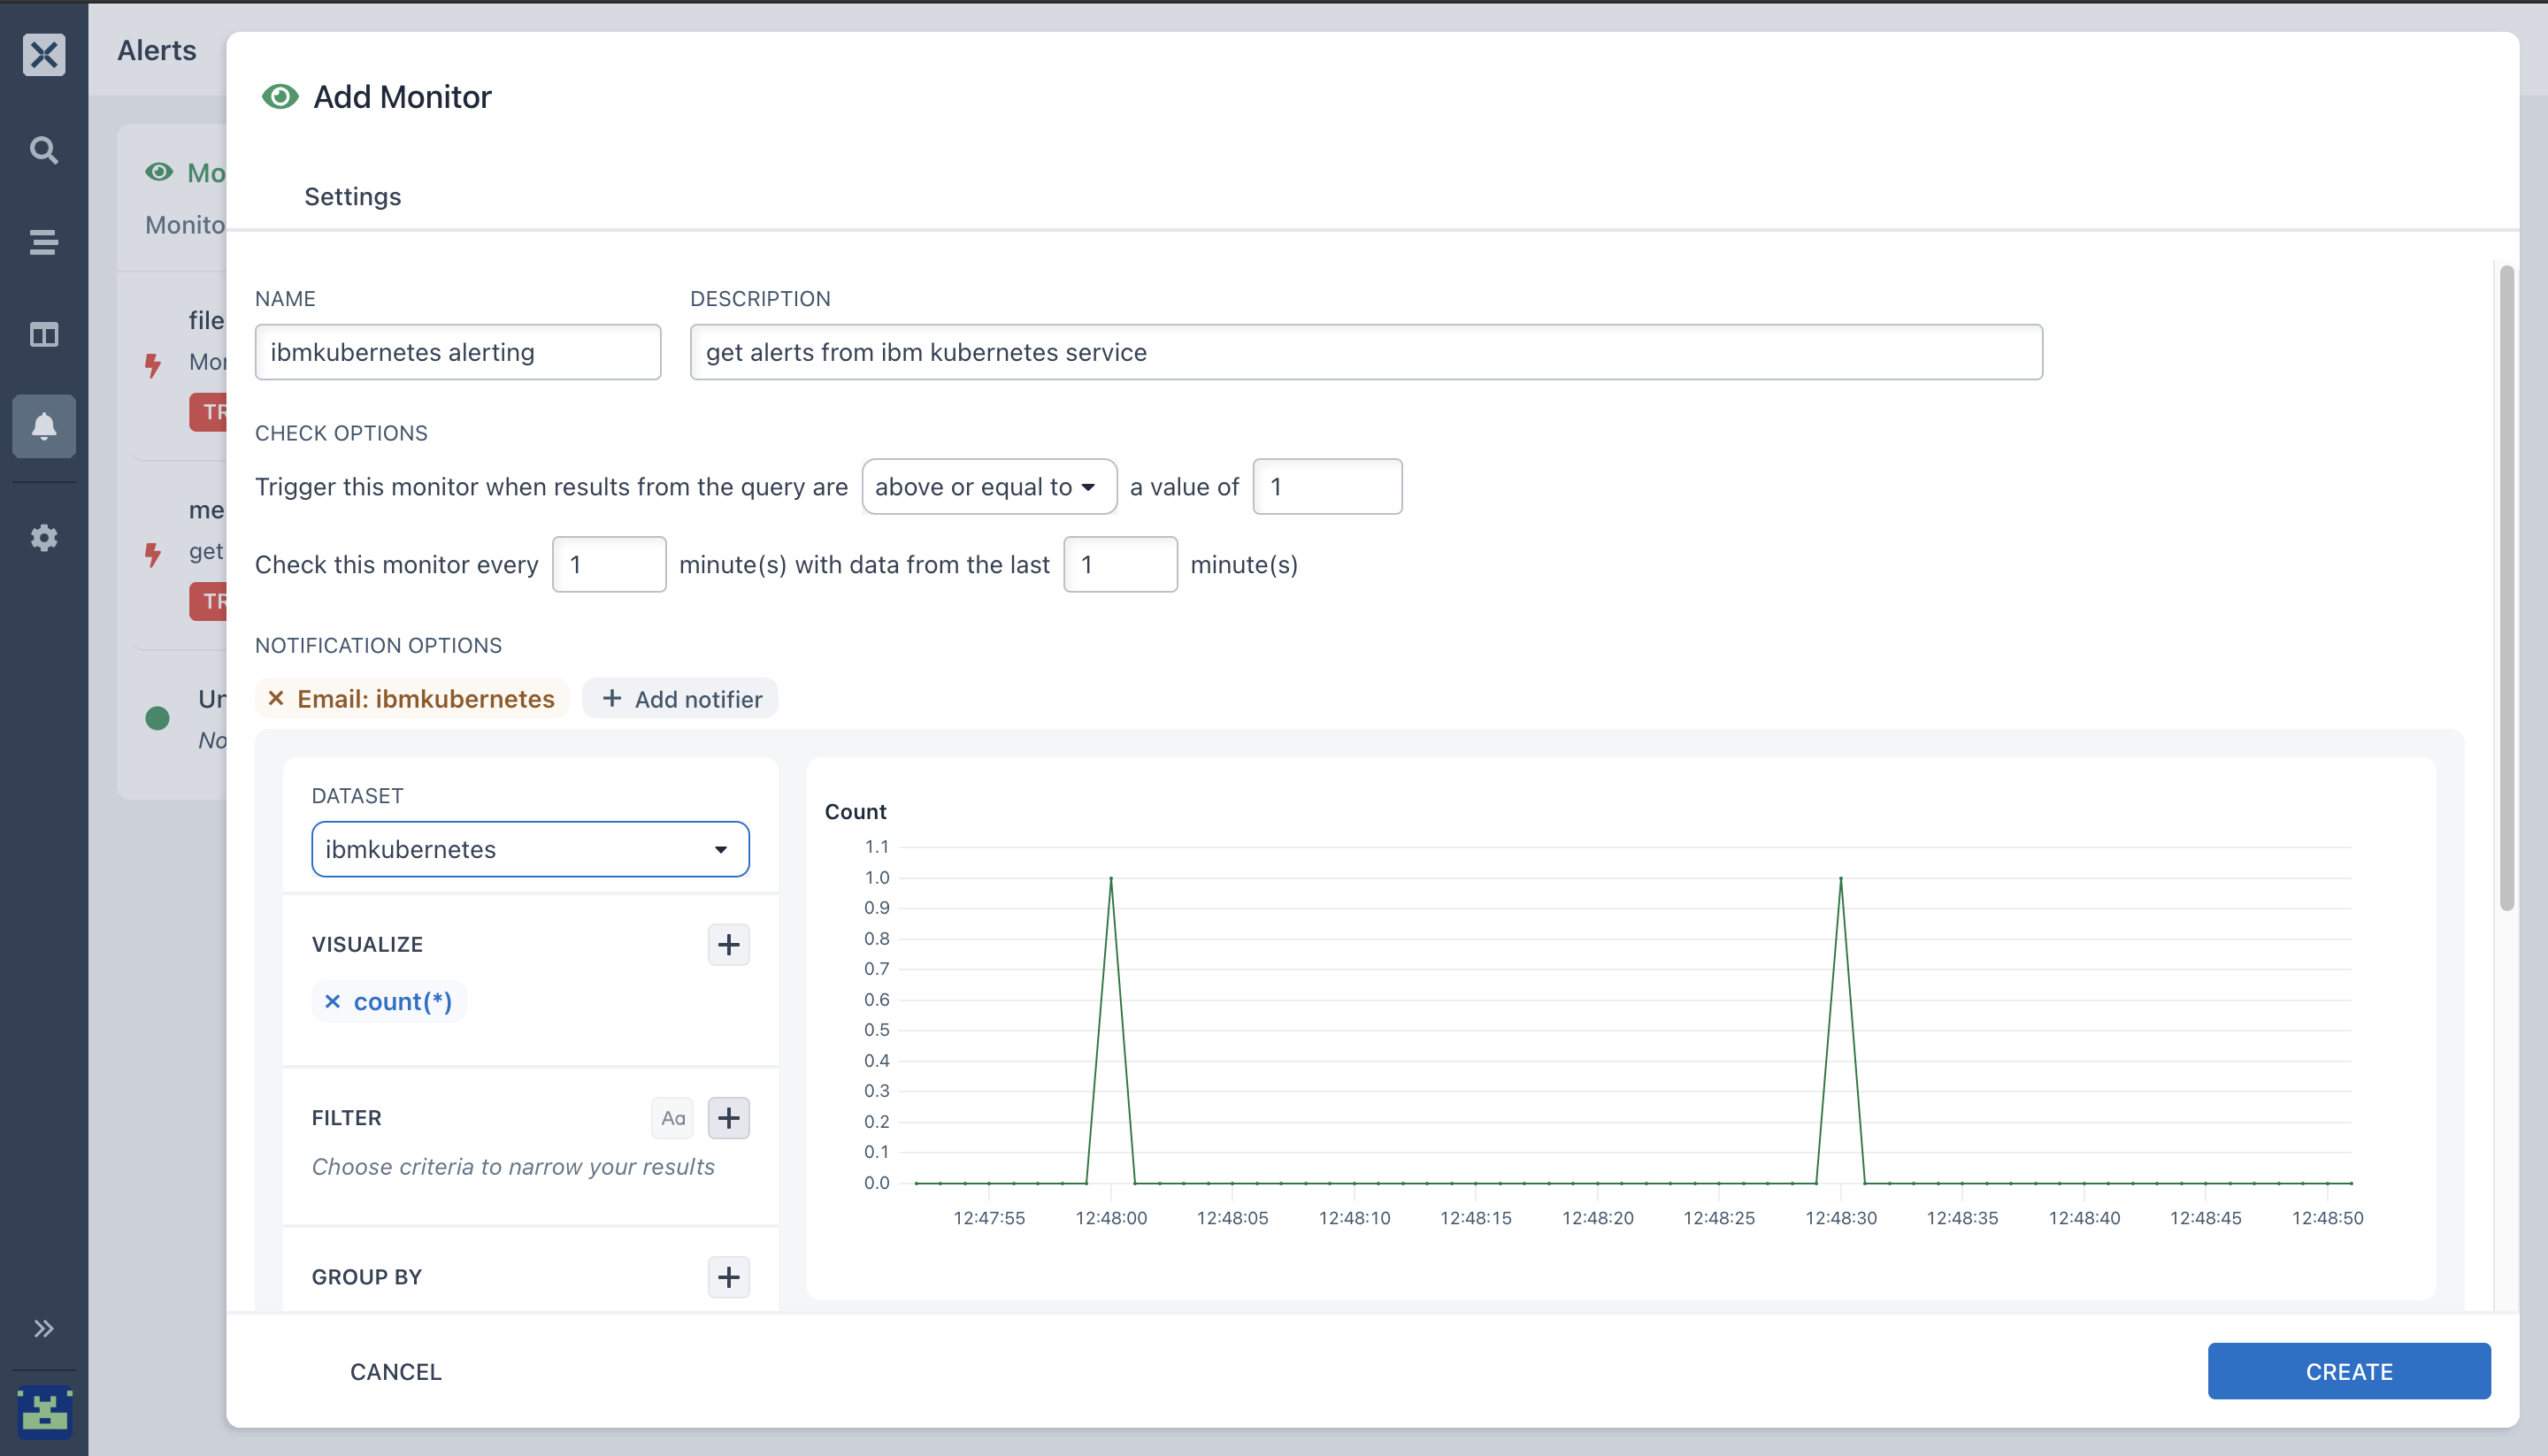
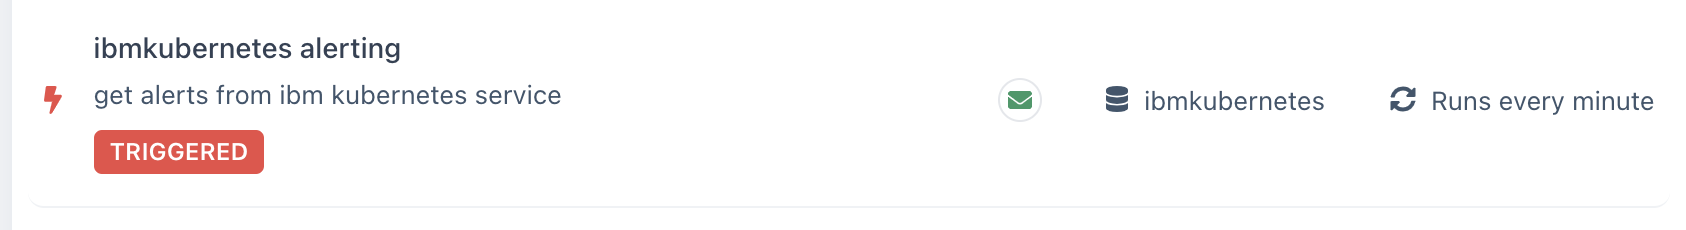
The name of my monitor is:
ibmkubernetesalerting -
Description - get alerts from ibm kubernetes service. Inserting a description is very useful especially for your team members so that they can know what exactly your Monitor is for.
-
For Trigger options, I set the comparison type to below or equal to the value of 1.
1is the value to compare the results of the network traffic query to. You can input any value you want for your monitor to get triggered. So, whenever your logs from youribm kubernetes serviceis being triggered, you will get an alert from what you configured in step 15 that the threshold state of your pods is above the value of1 -
Specify the frequency and time range for your monitor. Here I configured mine to check this monitor for every 1 minute with data from the last 1 minute
-
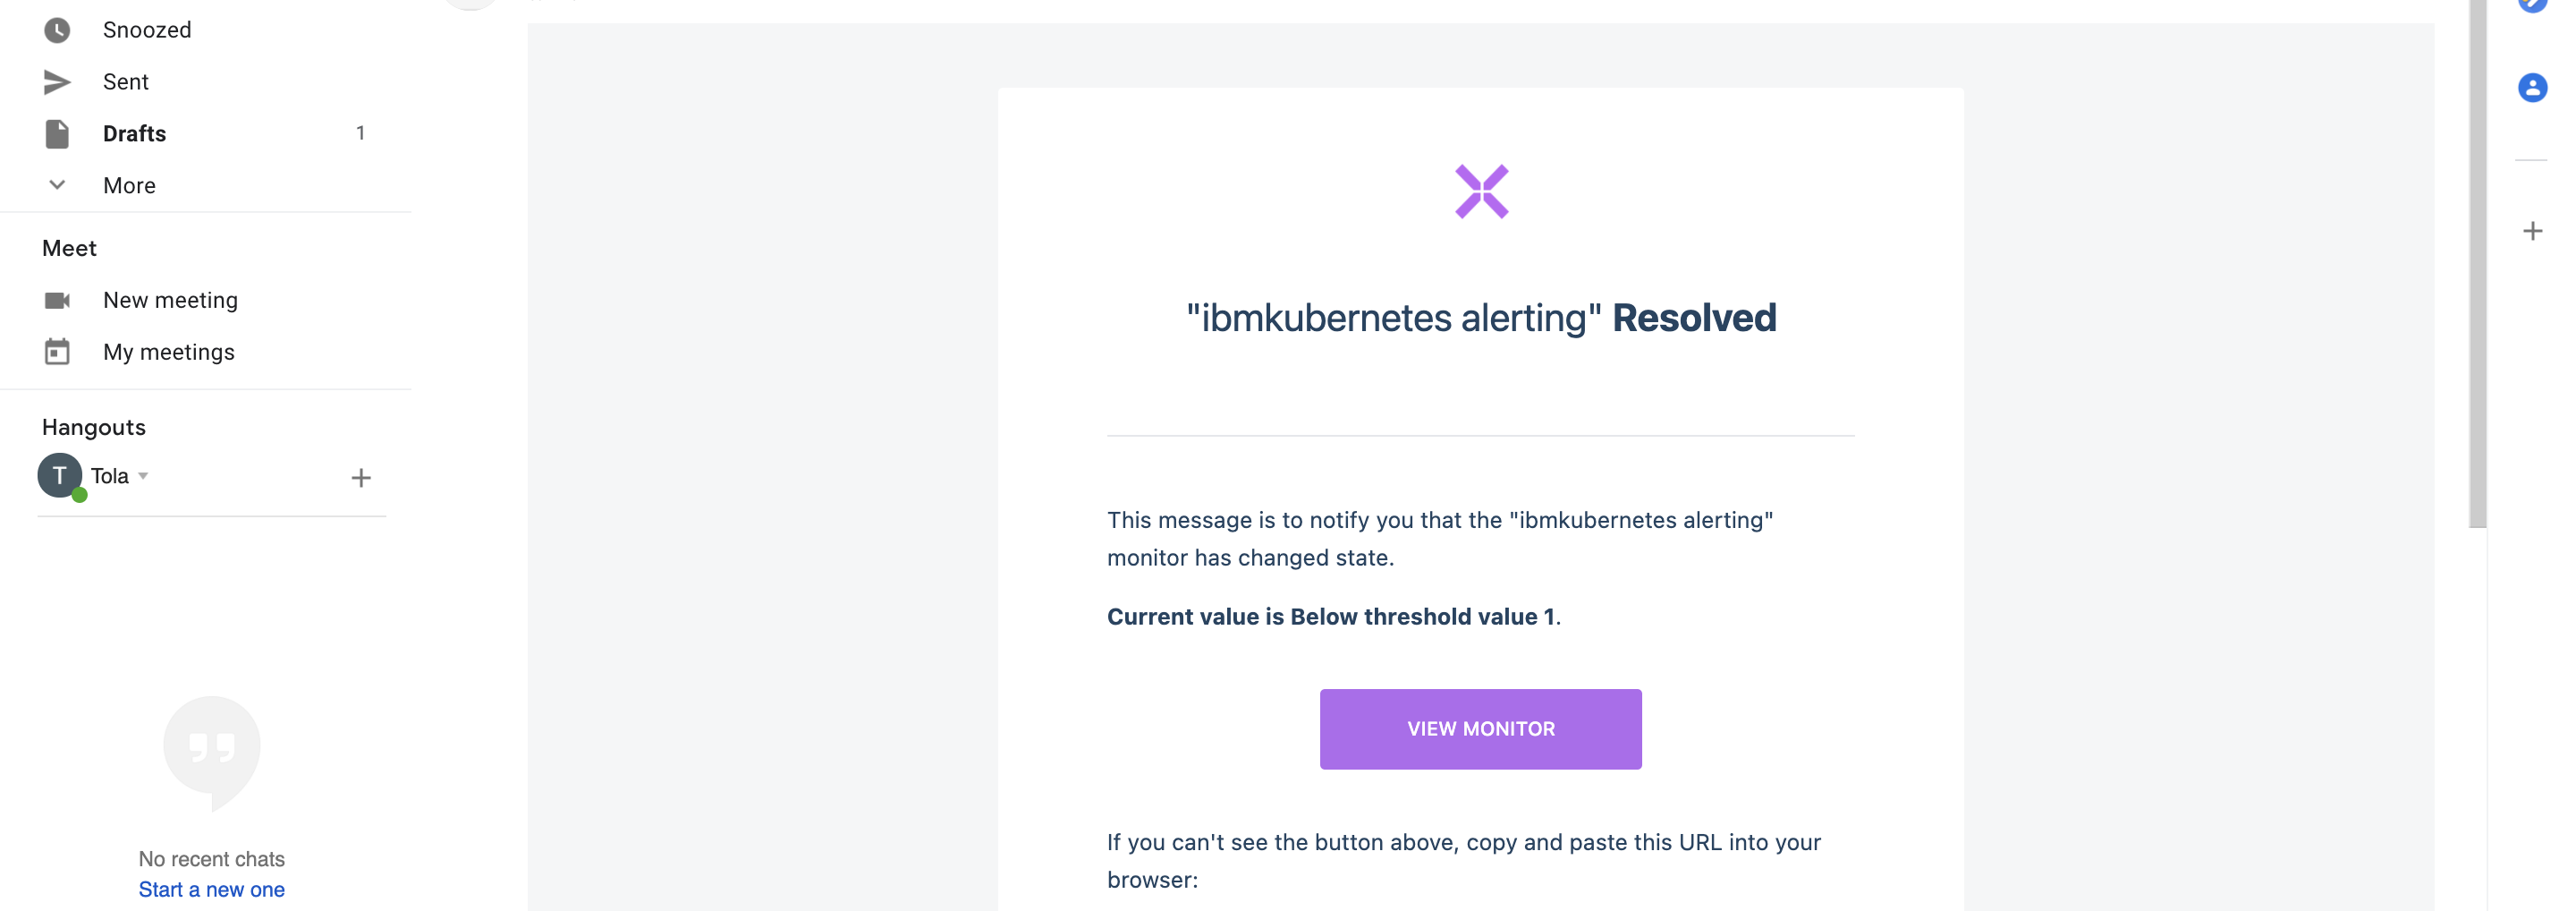
Select your notification option. Here I'm selecting the notification via Email which I configured in step 15.
-
Select the dataset in which you ingested logs from
ibmkubernetesearlier. -
Choose the Aggregation type you want to run your Query on. Here I configured my query using the
countaggregation. Using thecountaggregation, I want to get the alerts from all matching events whenever the threshold value isabove or equal toto 1. It will trigger the monitor and send an alert to my email. -
You can also add more monitors to get the lowest value, maximum value, from all your
Kubernetes logsbut when it reaches the threshold value you set on your monitor, it sends an alert to your E-mail or the specified Notifier you configured.
- When you are done configuring your Monitor, go back to your Monitor's page,
wait for 1 minute.You will see that your alert has been triggered.
- Go back to your Email or whichever Notifier you configured earlier to see the Notification. I received an email alert that my network logs have changed state.
You can configure your monitors to get triggered at any
value,frequency,period,rate,interval, andtime range
Time to Checkout 🌈
There is a lot that Axiom can do to help you be more productive when creating and managing your resources and deployment.
If you have specific questions or issues configuring the file, I'd love to hear about them. Contact us here or ask a question in our Discord community!
You can also follow us on Twitter and on our blog. And if you’ve enjoyed this post, please, take a second to share it on Twitter.
Check out other posts!!
- Monitoring Rancher with Axiom
- Ingress Logs from Azure Kubernetes Service to Axiom
- Monitor DigitalOcean Kubernetes Service with Axiom
Stay tuned for our next blog post 😇