Author


Tola Ore-Aruwaji
Developer Relations Engineer
Metricbeat collects metrics from sources which can be a file system, network, CPU processes, memory, and services. Metricbeat understands how to process your services into a specified format which is later on transmitted and shipped into a destination like Axiom. Using Metricbeat, you can collect metrics from your CPU, memory, Redis, Nginx and ship them directly to Axiom
Shipping your data from your systems CPU and memory to Axiom enables you to see your relevant application exceptions and errors in your environments.
Axiom transforms the metrics collected from your systems and services into insights. Using Axiom Data Explorer, you can see specific metric visualizations, quickly isolate and troubleshoot issues.
In this tutorial, I will show you how to ship Metricbeat data from your applications directly to Axiom.
Currently, we support all versions of Metricbeat.
Prerequisites
Let’s get started 💡
-
Firstly, visit our docs to copy, edit, and configure your module and metricsets.
-
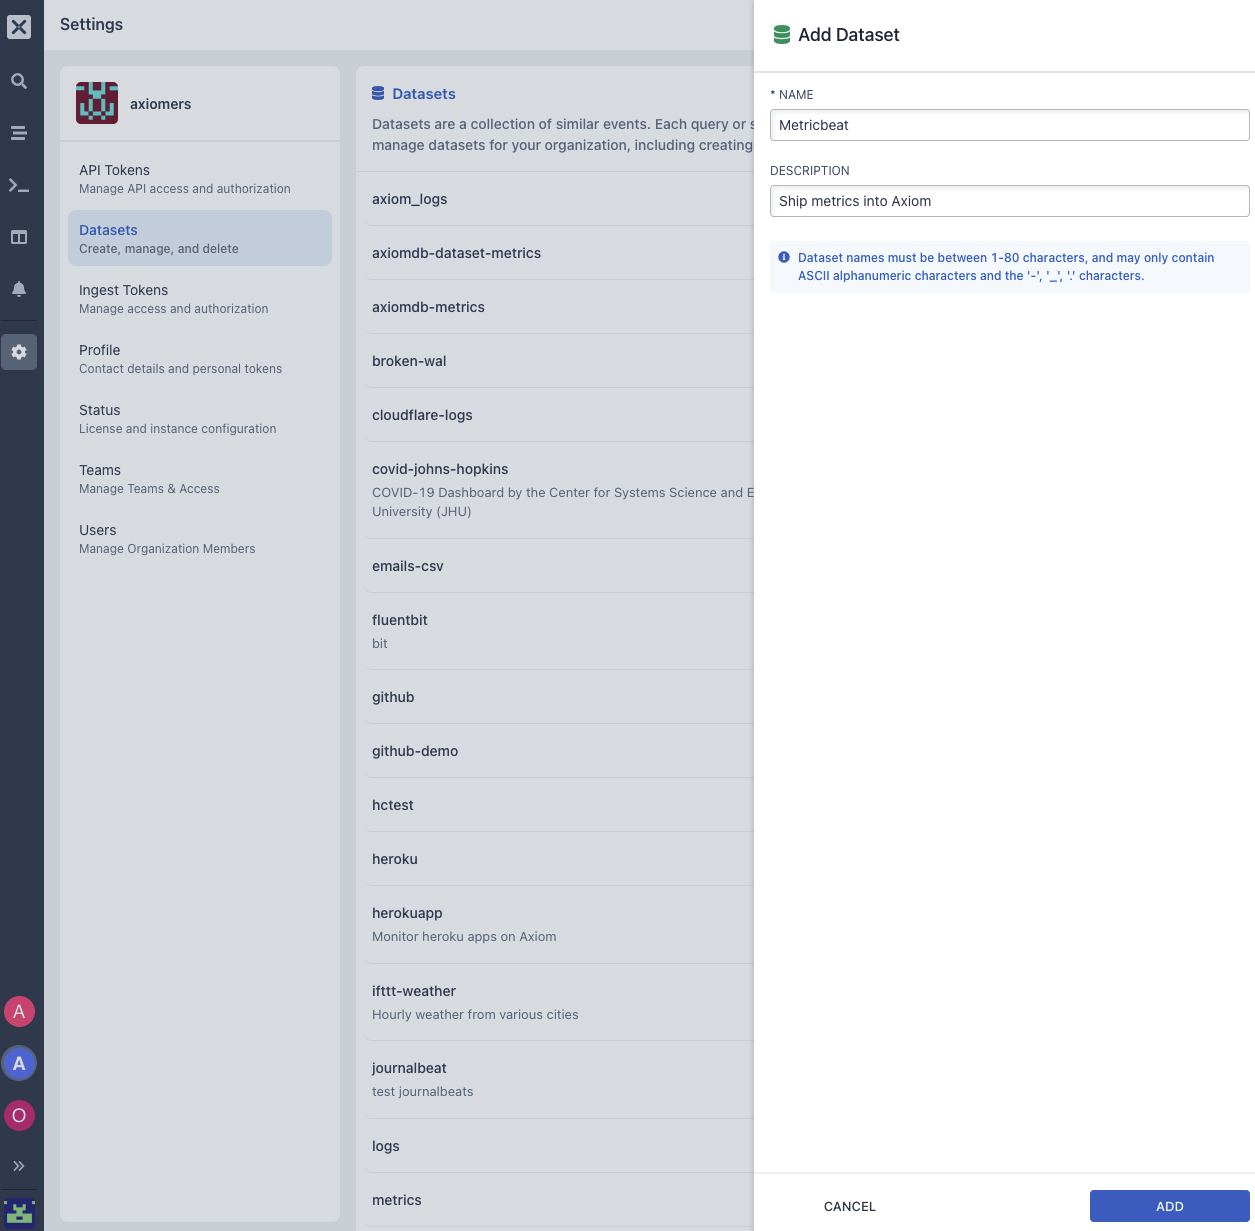
Create your dataset for your Metricbeat logs by selecting Settings → Datasets.
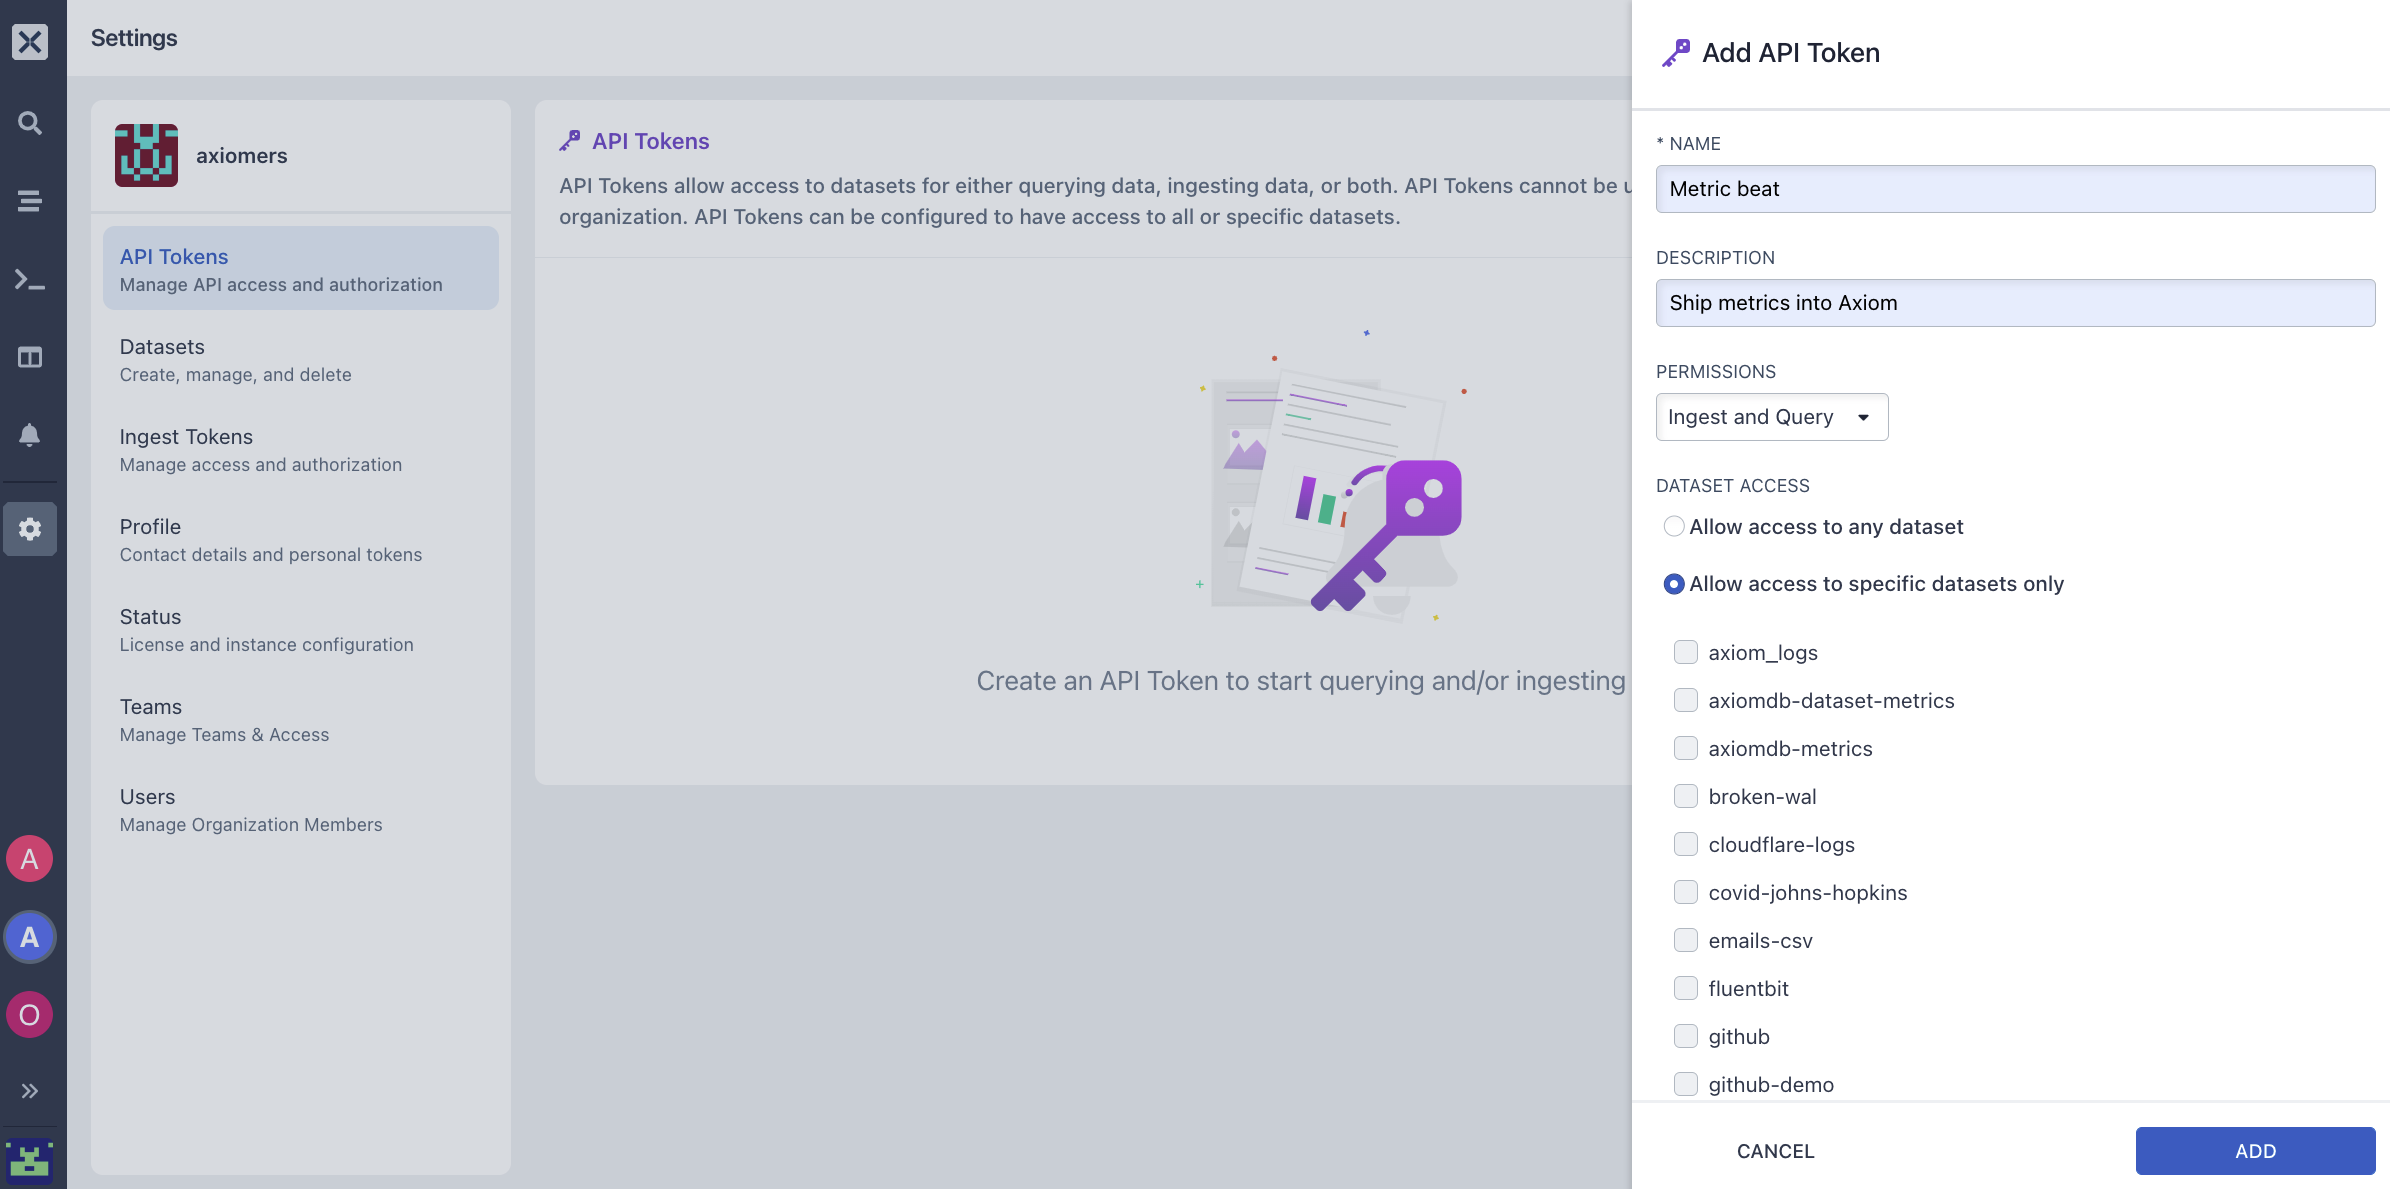
- Generate your API token,
- On the Axiom UI, click on settings, select API Tokens.
- Select Add ingest token.
- Enter a name, description and select the permissions you want to give your token. You can choose Ingest and Query, Ingest or Query permissions for your token.
- Copy the generated token to your clipboard. Once you navigate from the page, the token can be seen again by selecting API Tokens.
- Next, update your configuration with your new
$DATASET_NAMEwe created in step 2 and yourapi_tokenwe created in step 3.
metricbeat.modules:
setup.ilm.enabled: false
metricbeat.config.modules:
metricbeat.modules:
- module: system
  metricsets:
    - filesystem
output.elasticsearch:
  hosts: ["https://app.axiom.co:443/api/v1/datasets/$DATASET_NAME/elastic"]
  # token should be an ingest token
api_key: 'axiom:$TOKEN'- When you are done with your configuration, you can now run your configuration and ship your Metricbeats statistics and metrics from your filesystem, network and memory directly to Axiom.
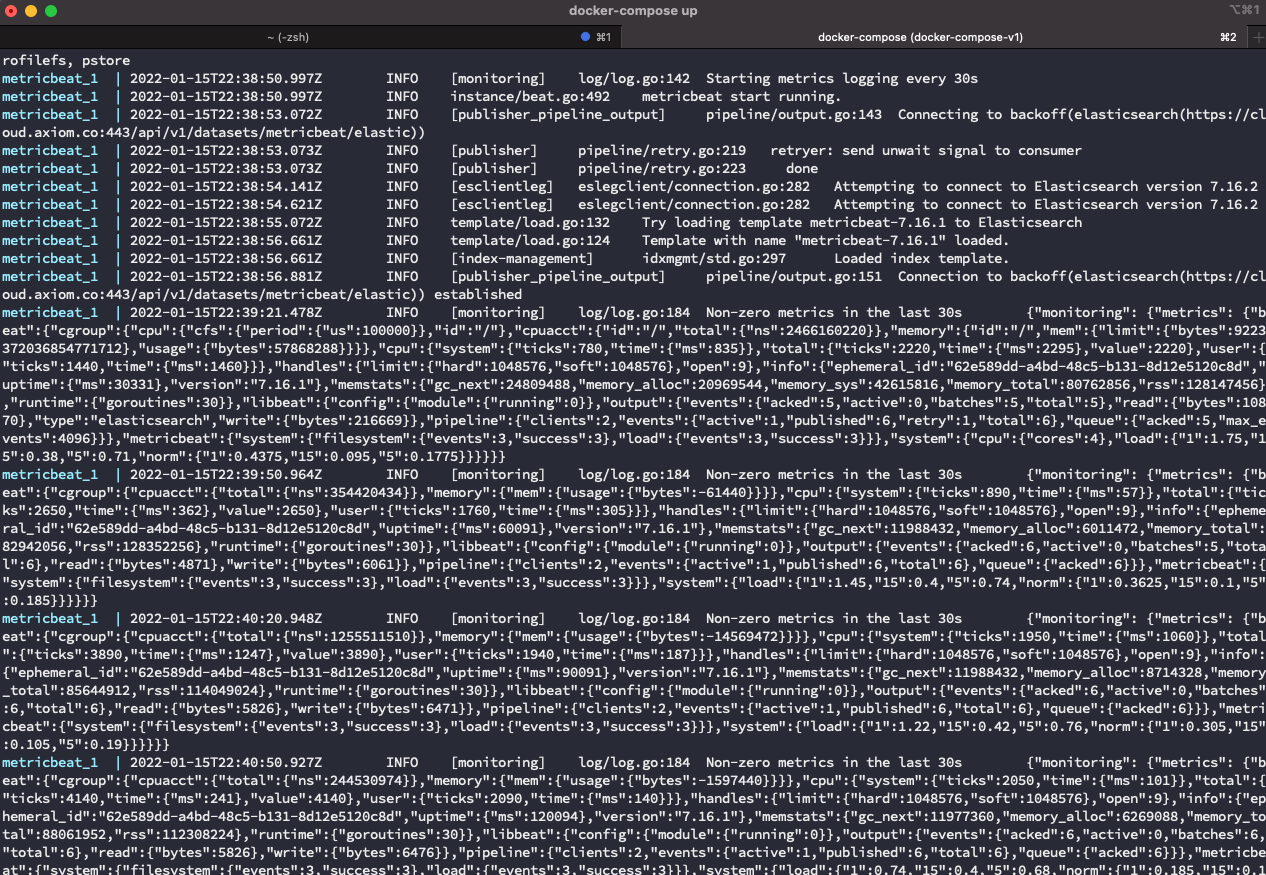
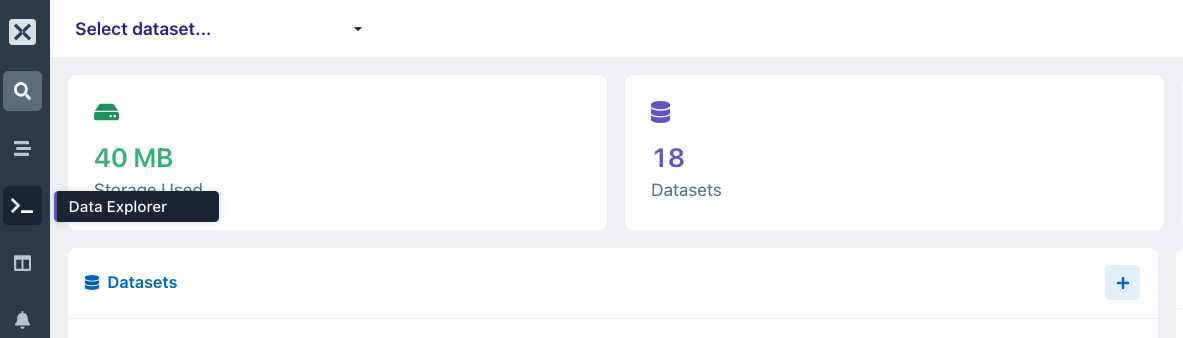
- Visit your dataset in your Axiom Cloud console you can see your statistics and metrics from your services directly in your dataset view.
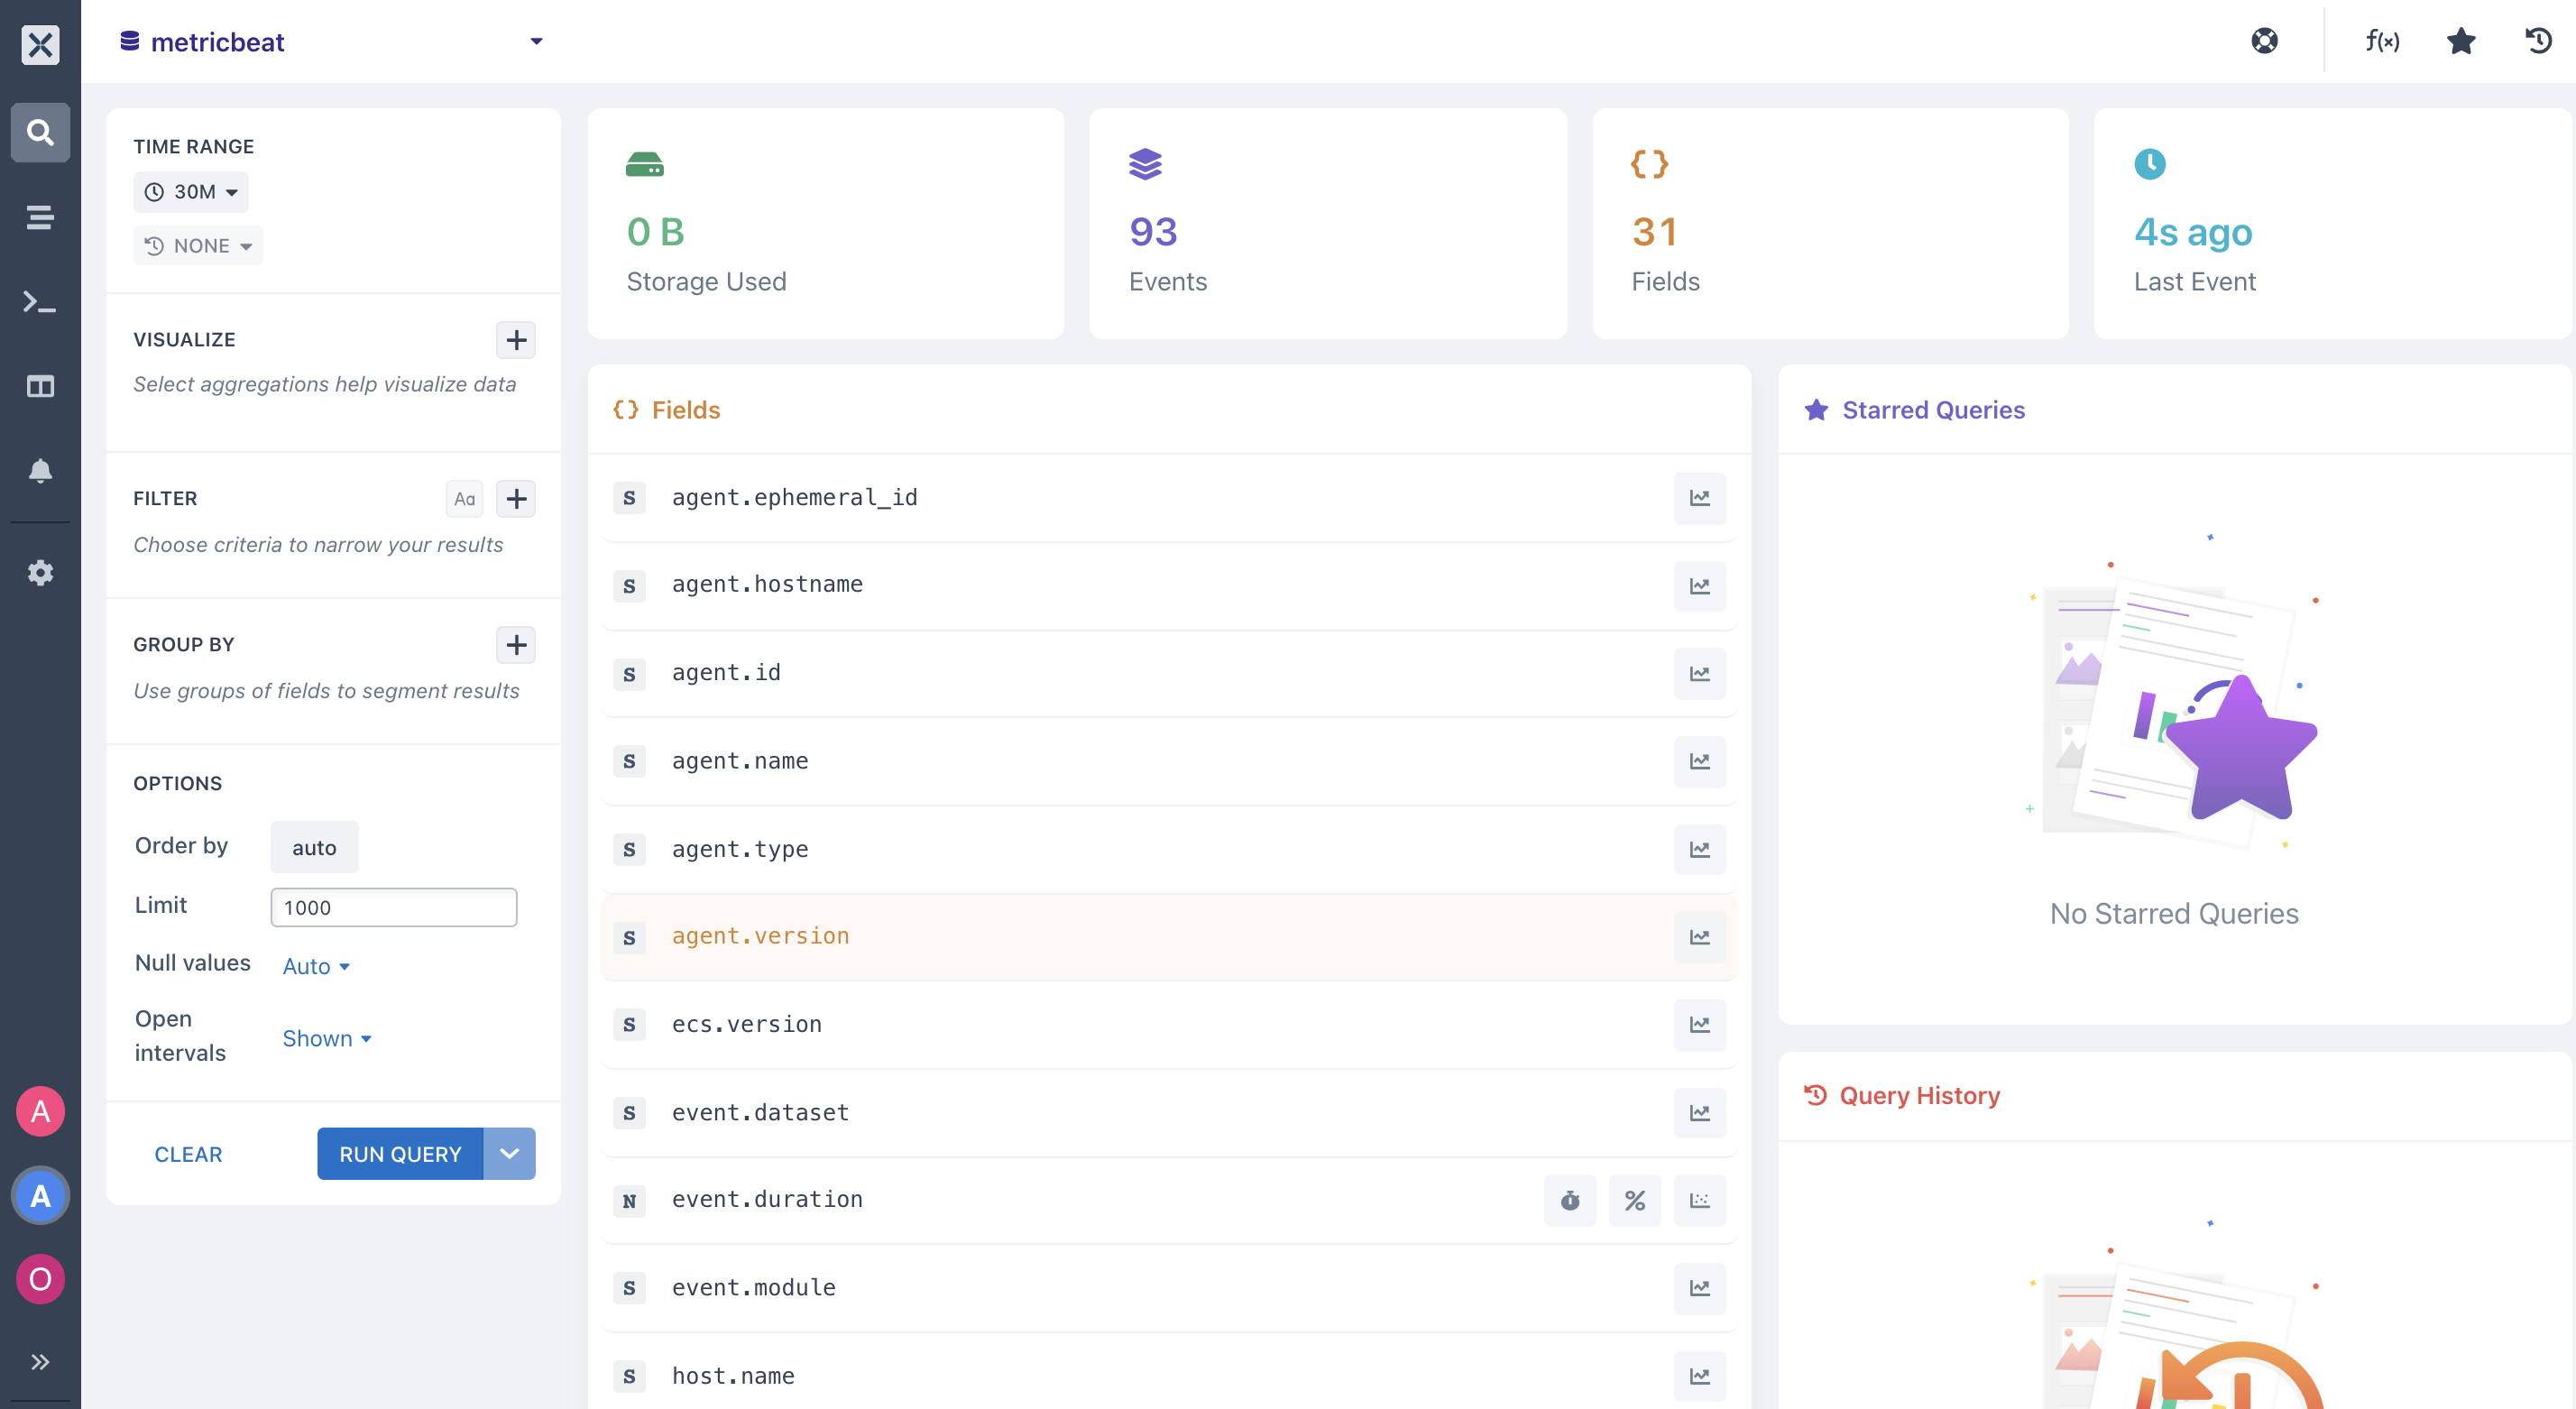
- You can analyze and run queries on your dataset using different aggregations. This lets you visualize the output of your metrics and segment your statistics across all or a subset of events in your Metricbeat dataset.
- In this diagram, we want to know the
mean valueon our available filesystem,minimum valueon our system load andmaximum valueon our file system packet.
When you select your field, it outputs a chart that contains the minimum value, average value, and maximum value for each time duration in the table below the chart.
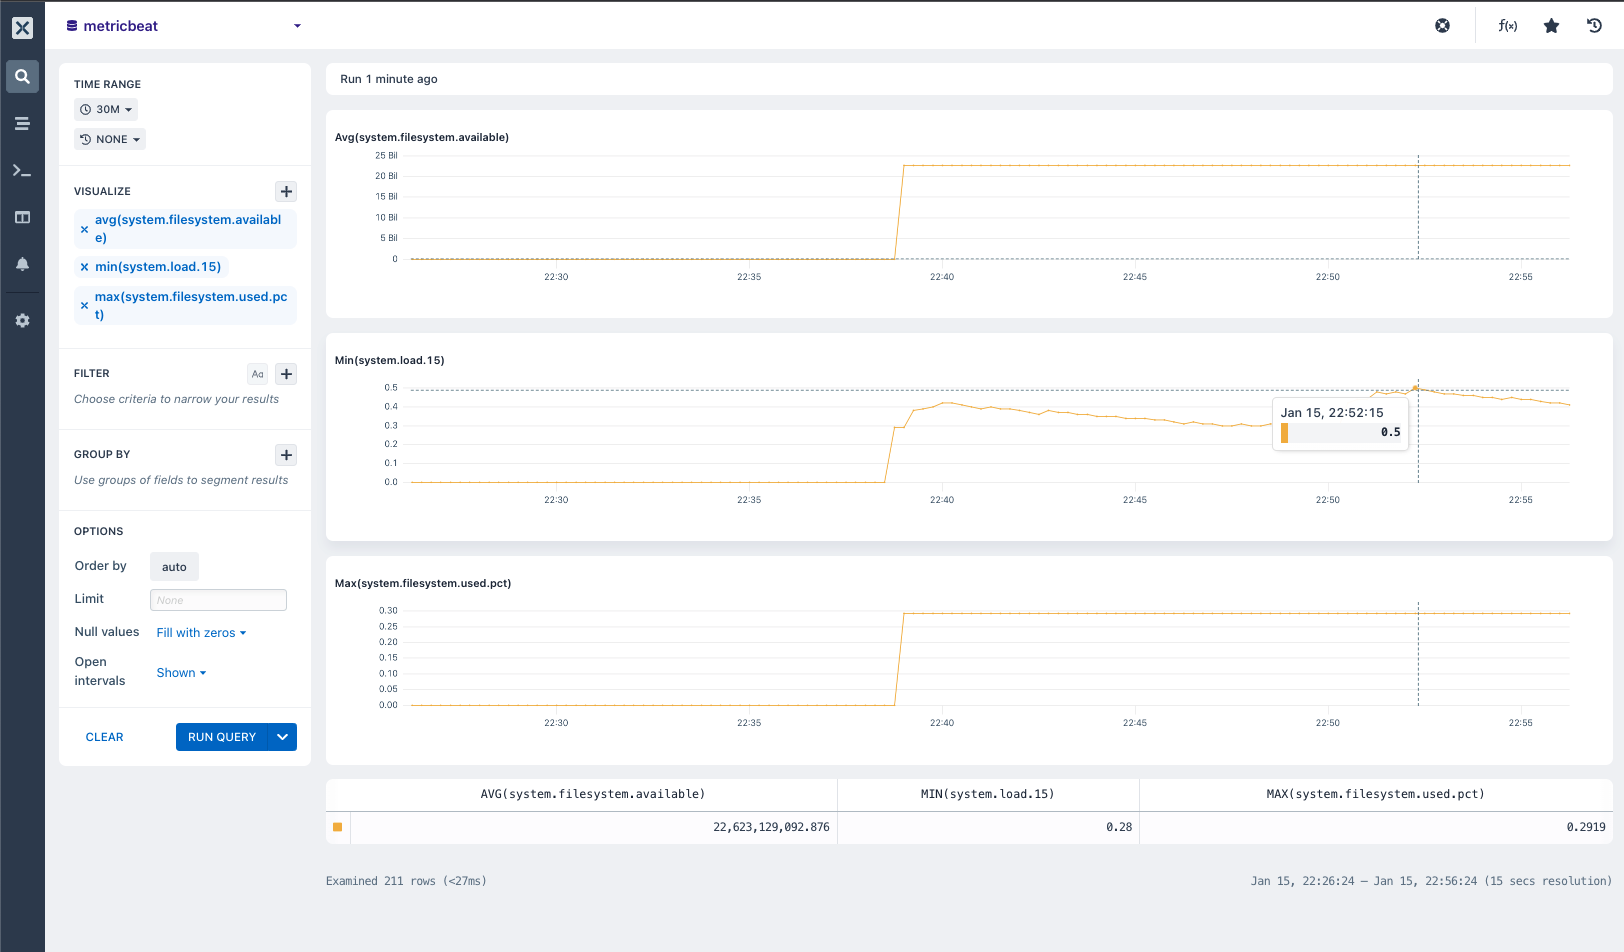
- You can also run other aggregations like
topk()to know the “top 4” or “top 10” (where ‘4’ and ’10’ are ‘k’ in the topk) values for a field(s) in your Metricbeat dataset.
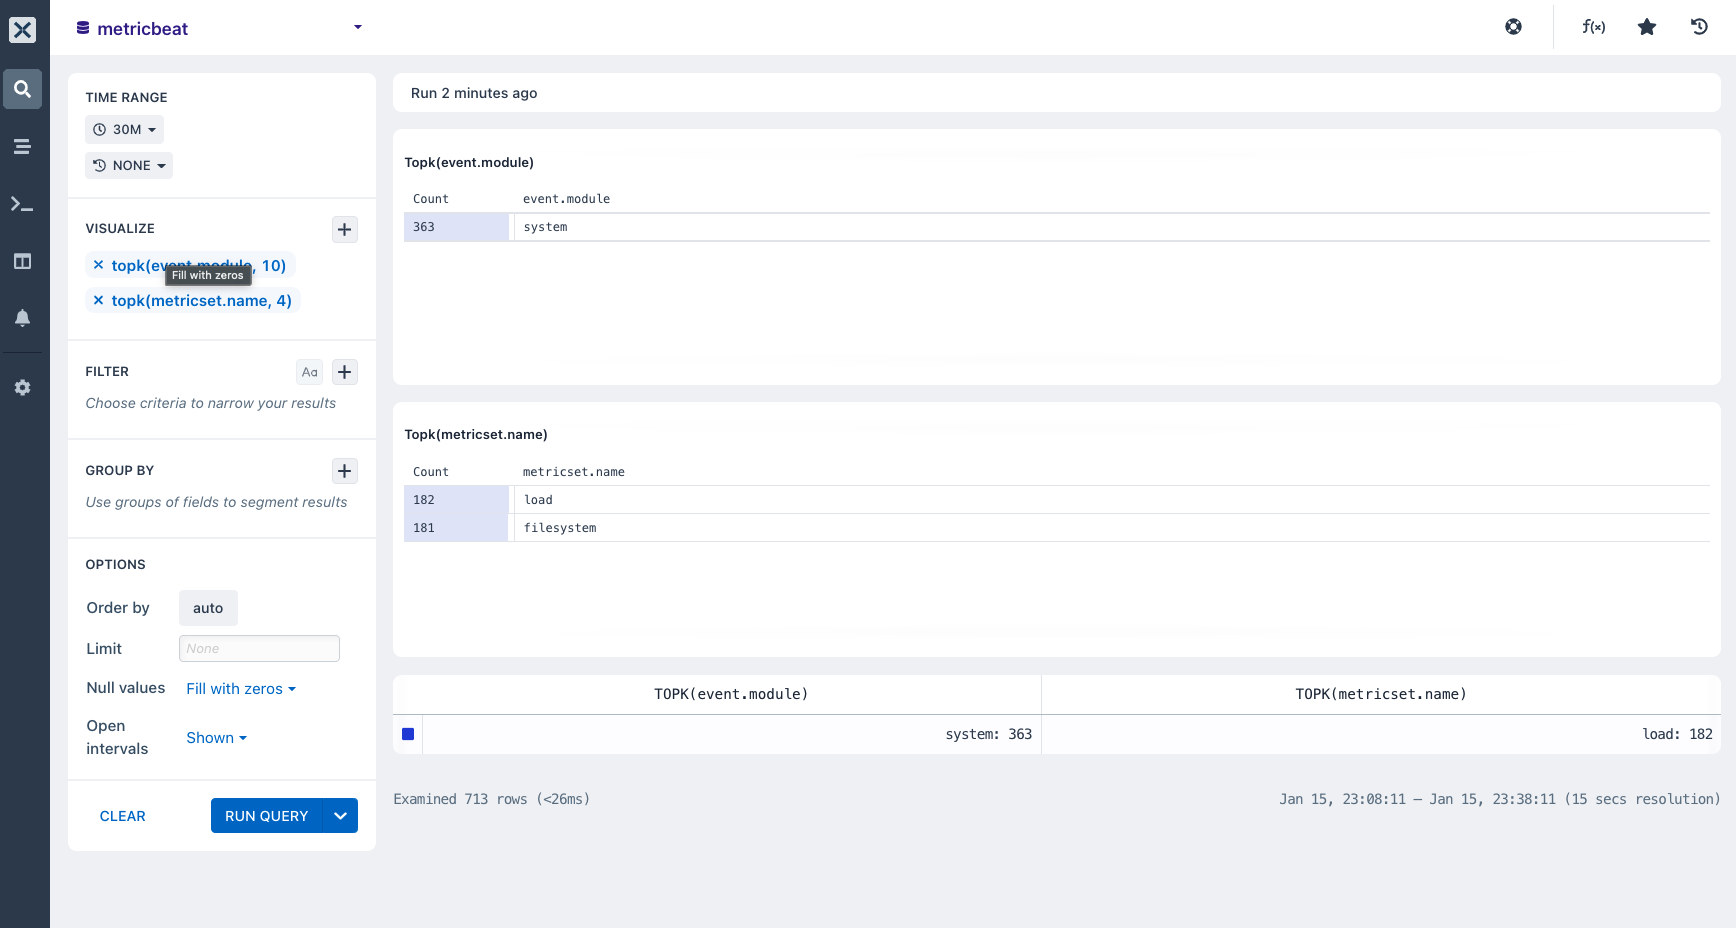
- You can also run queries, monitor your datasets, and get insights into your resources using Axiom Data Explorer.
In Axiom UI, select the fourth icon, which is the Data Explorer icon on the pane.
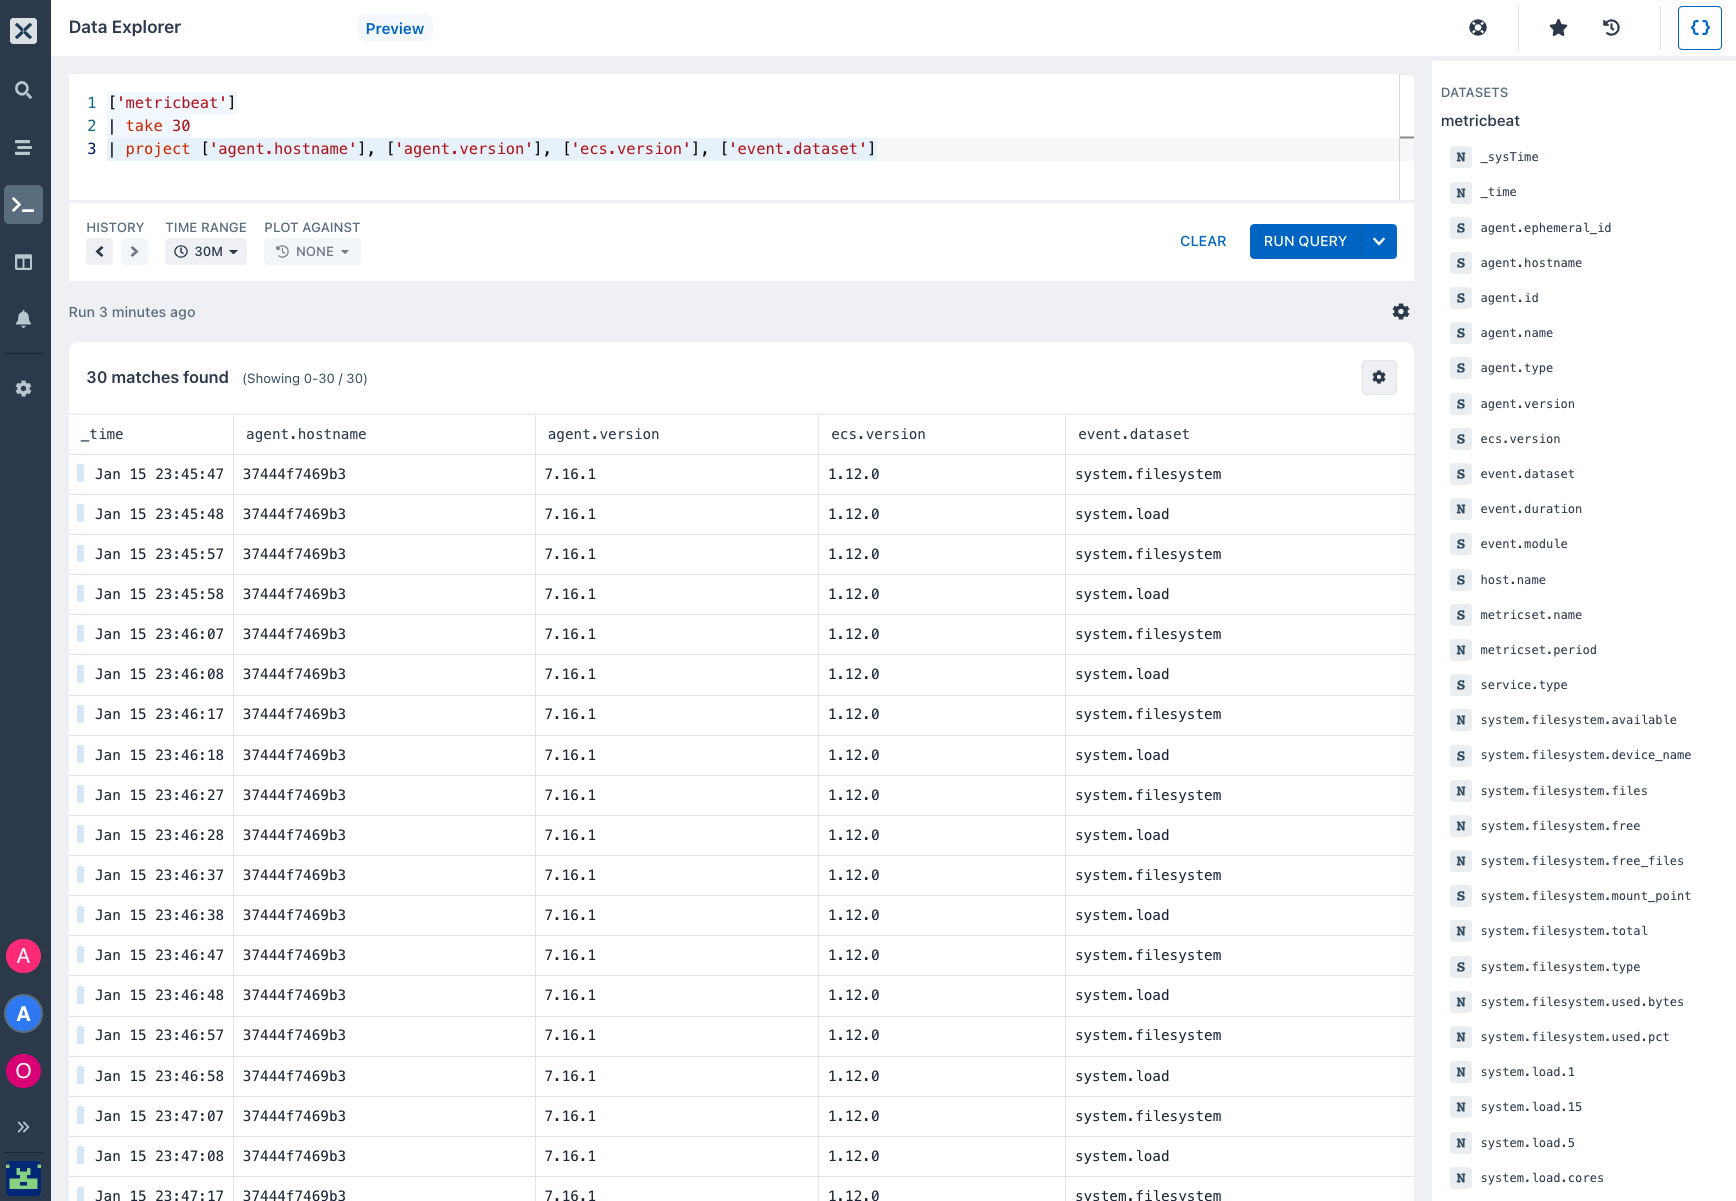
- Start by typing your metricbeat dataset name, then your query.
-
A query consists of a sequence of query statements, with at least one statement being a tabular expression statement. The query's tabular expression statements produce the result of the query.
-
The syntax of the tabular expression tabular flow from one query operator to another, starting with your Metricbeat dataset name and then flow through a set of data operators and functions that are bound together through the use of the pipe
|delimiter.
- On your Metricbeat dataset, you can start running queries using our operators and functions. This will enable you to gain direct insights into your filesystem, load, memory, and network metrics also know how they are performing and behaving especially when downtime and errors occur.
- Project Operator: Using the
projectoperator we selectedfieldsto insert and embed new columns. The following query returns fields;agent.hostnameagent.versionecs.versionandevent.datasetas columns.
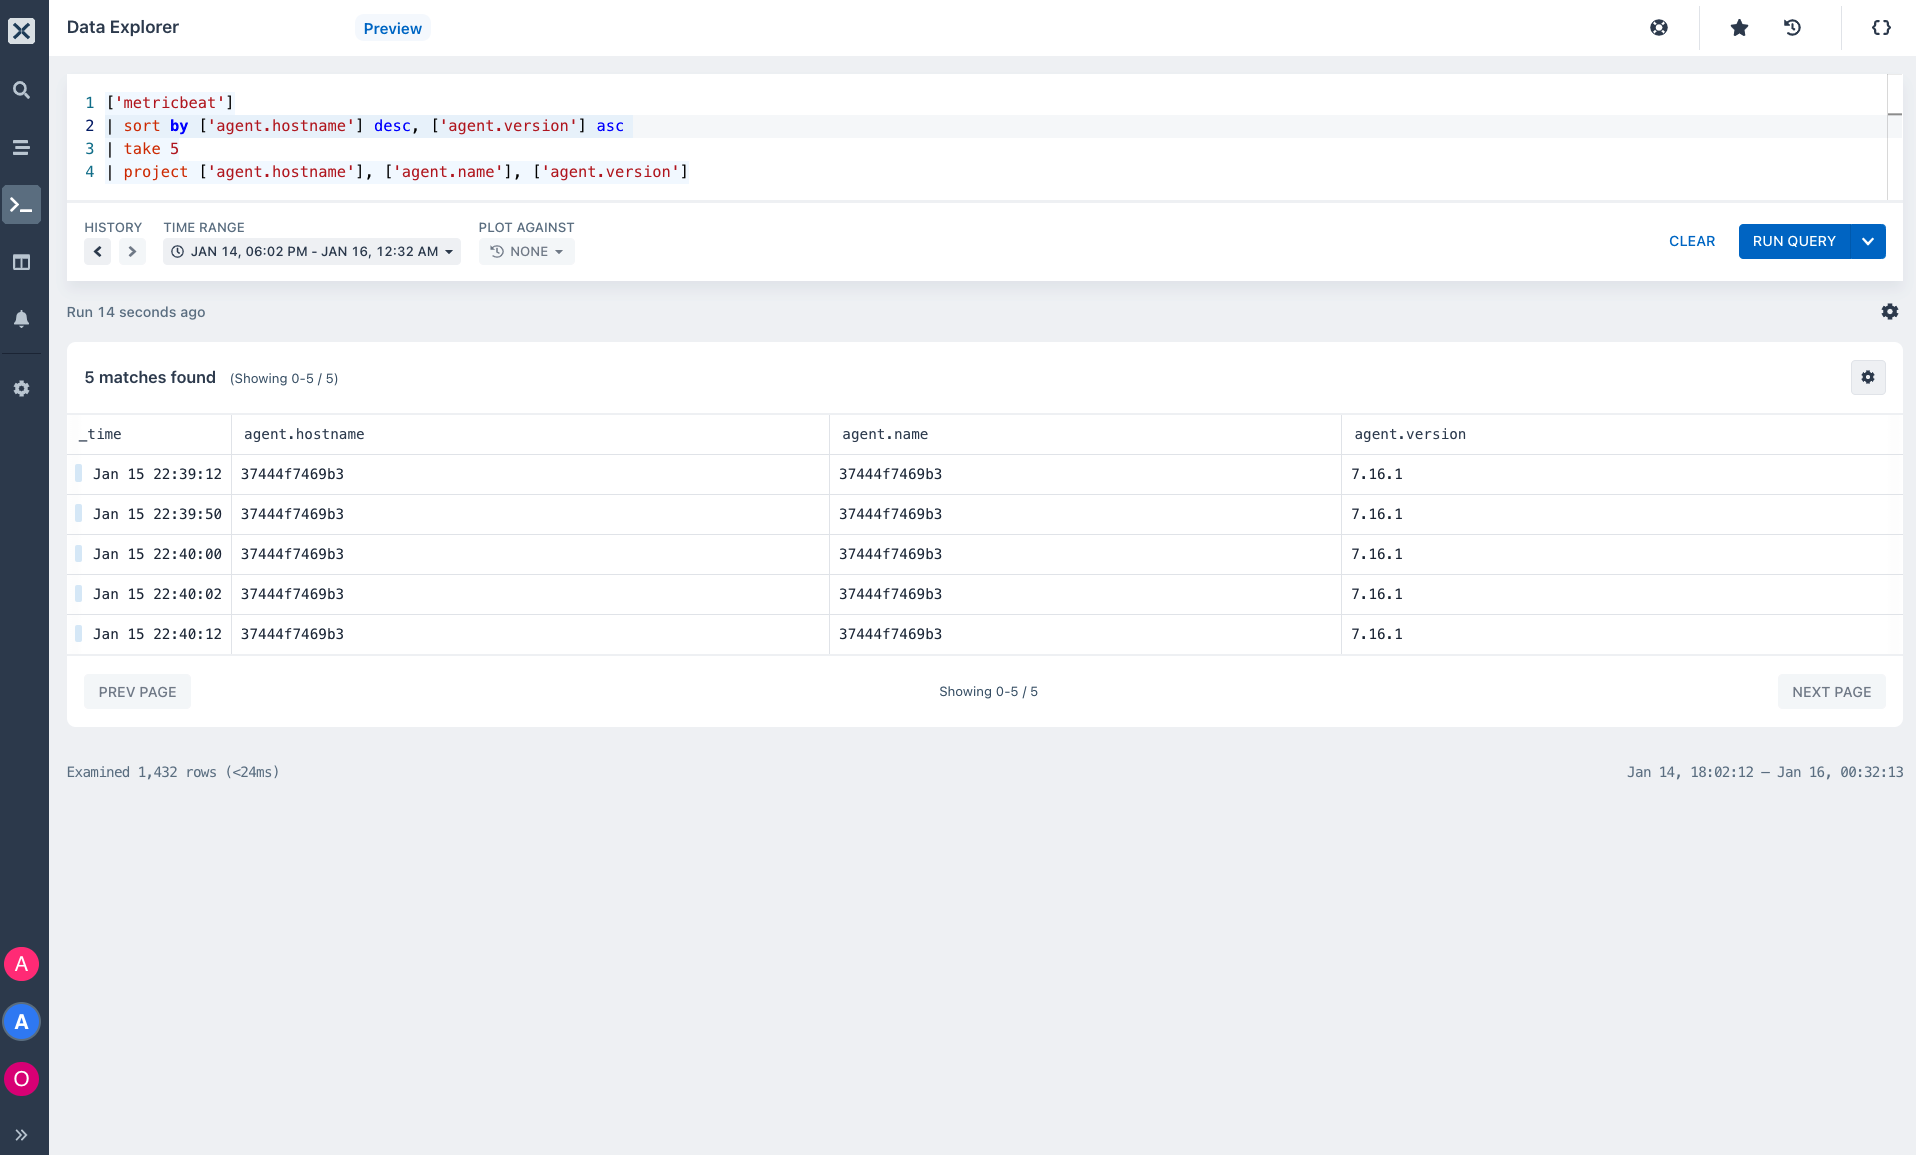
- Sort the rows of your metrics into order by one or more columns.
The following query sorts the data in descending order by agent.hostname and ascending by agent.version
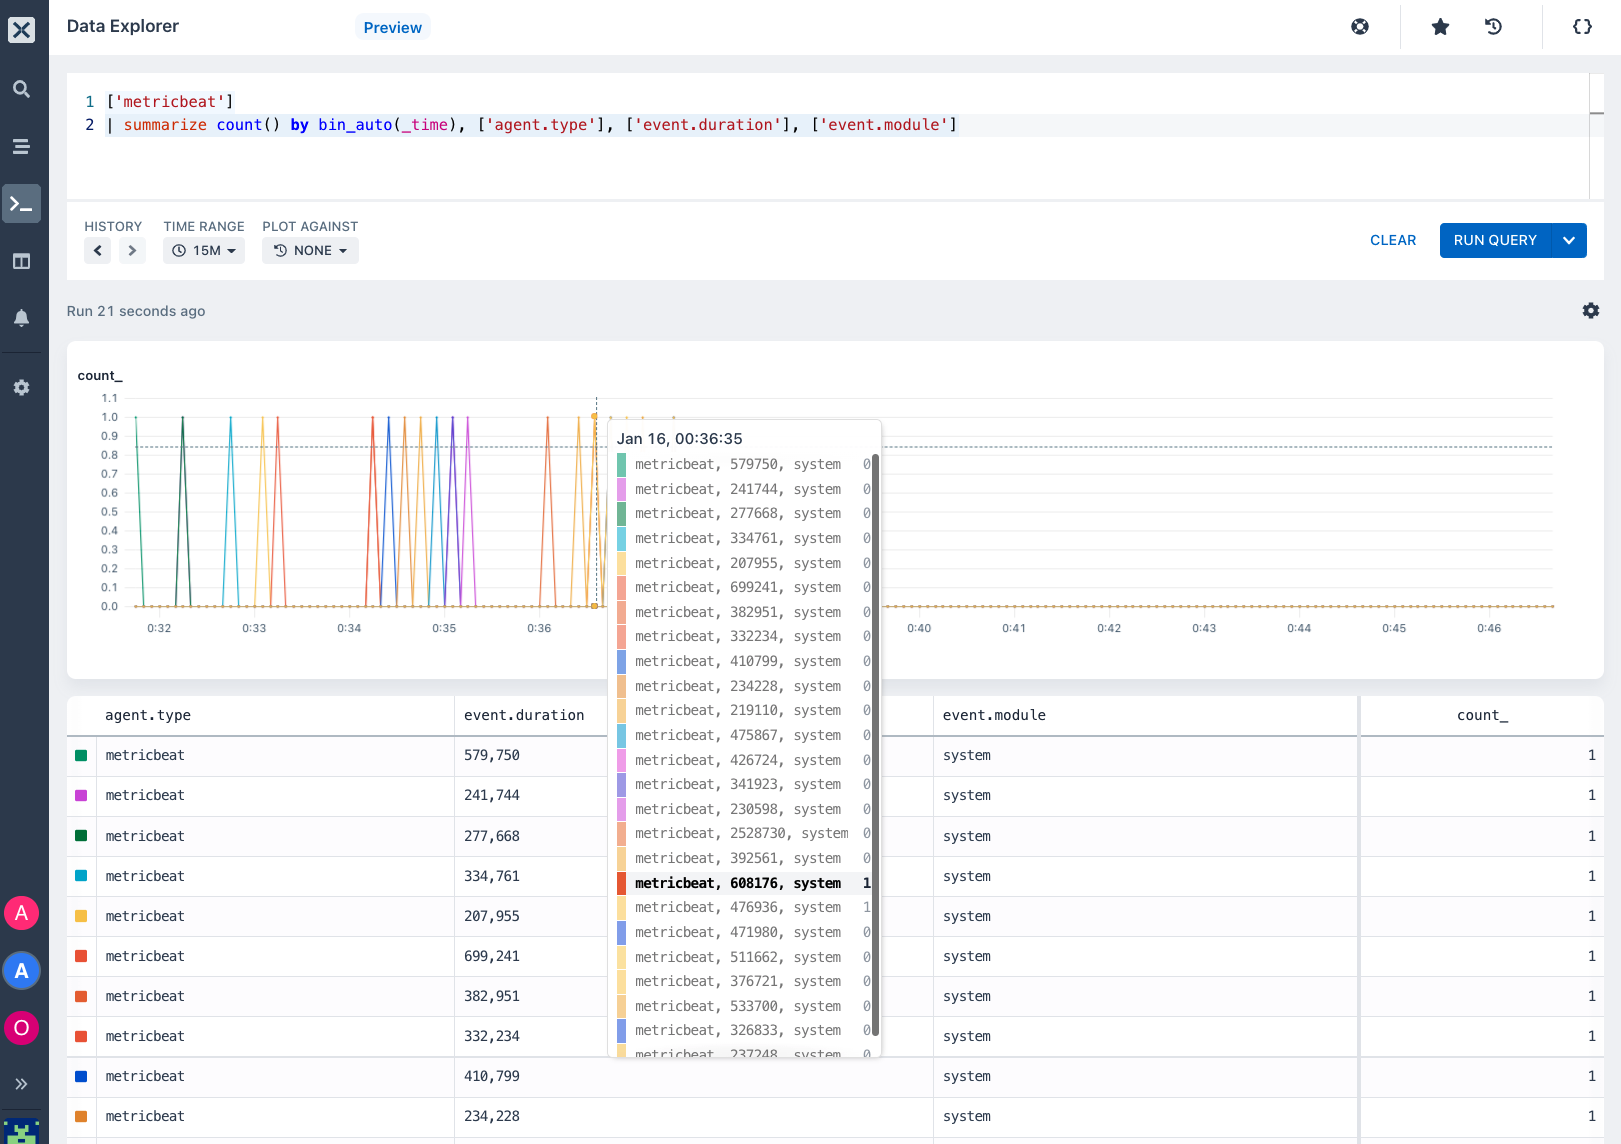
- Produce a table that aggregates all the content of your dataset using the
summarizeoperator.
The summarize operator groups together rows that have the same values in the by clause. In the query below, each group is split into four rows. There is a row for agent.type event.duration event.module and count_
Whew! I love learning, don’t you? 😌
We've got our Sandbox for you to play with different datasets like the; sample-http-logs dataset, hackernews dataset, and Github (fork, issues, pull request, and push-event dataset)
- Sign up for Axiom Cloud - The fastest and simplest way to get started with Axiom.
- Click this link to join other developers in the Axiom community who are using Axiom. Find resources, ask questions, and share your knowledge!
Explore other contents on our blog:
- Beginner's guide to Axiom Data Explorer.
- Getting the best out of Axiom's Log Streams
- Axiom processing language docs
Good luck!