
While log analytics can be powerful when you have a great idea of exactly what insights you would like to extract, sometimes you want to get a feel of how a system or deployment is doing live. With Axiom’s live streaming feature, you can quickly view, filter, and extract logs from any data source without breaking a sweat.
In this tutorial, I will show you how to accelerate your log investigation by building filters, exploring the different operators, and saving queries for you and your team.
Let’s dive in 😇
-
Before you can stream and accelerate your events on Axiom, you need to ingest your events into your dataset on Axiom.
-
To ingest events on Axiom, you need to create a new dataset and an ingest token. You can ingest events into Axiom using the Ingest API, any of our Data shippers, or using the Elasticsearch Bulk API that Axiom supports natively.
-
To create a new dataset, go to Settings → Datasets in the Axiom UI.
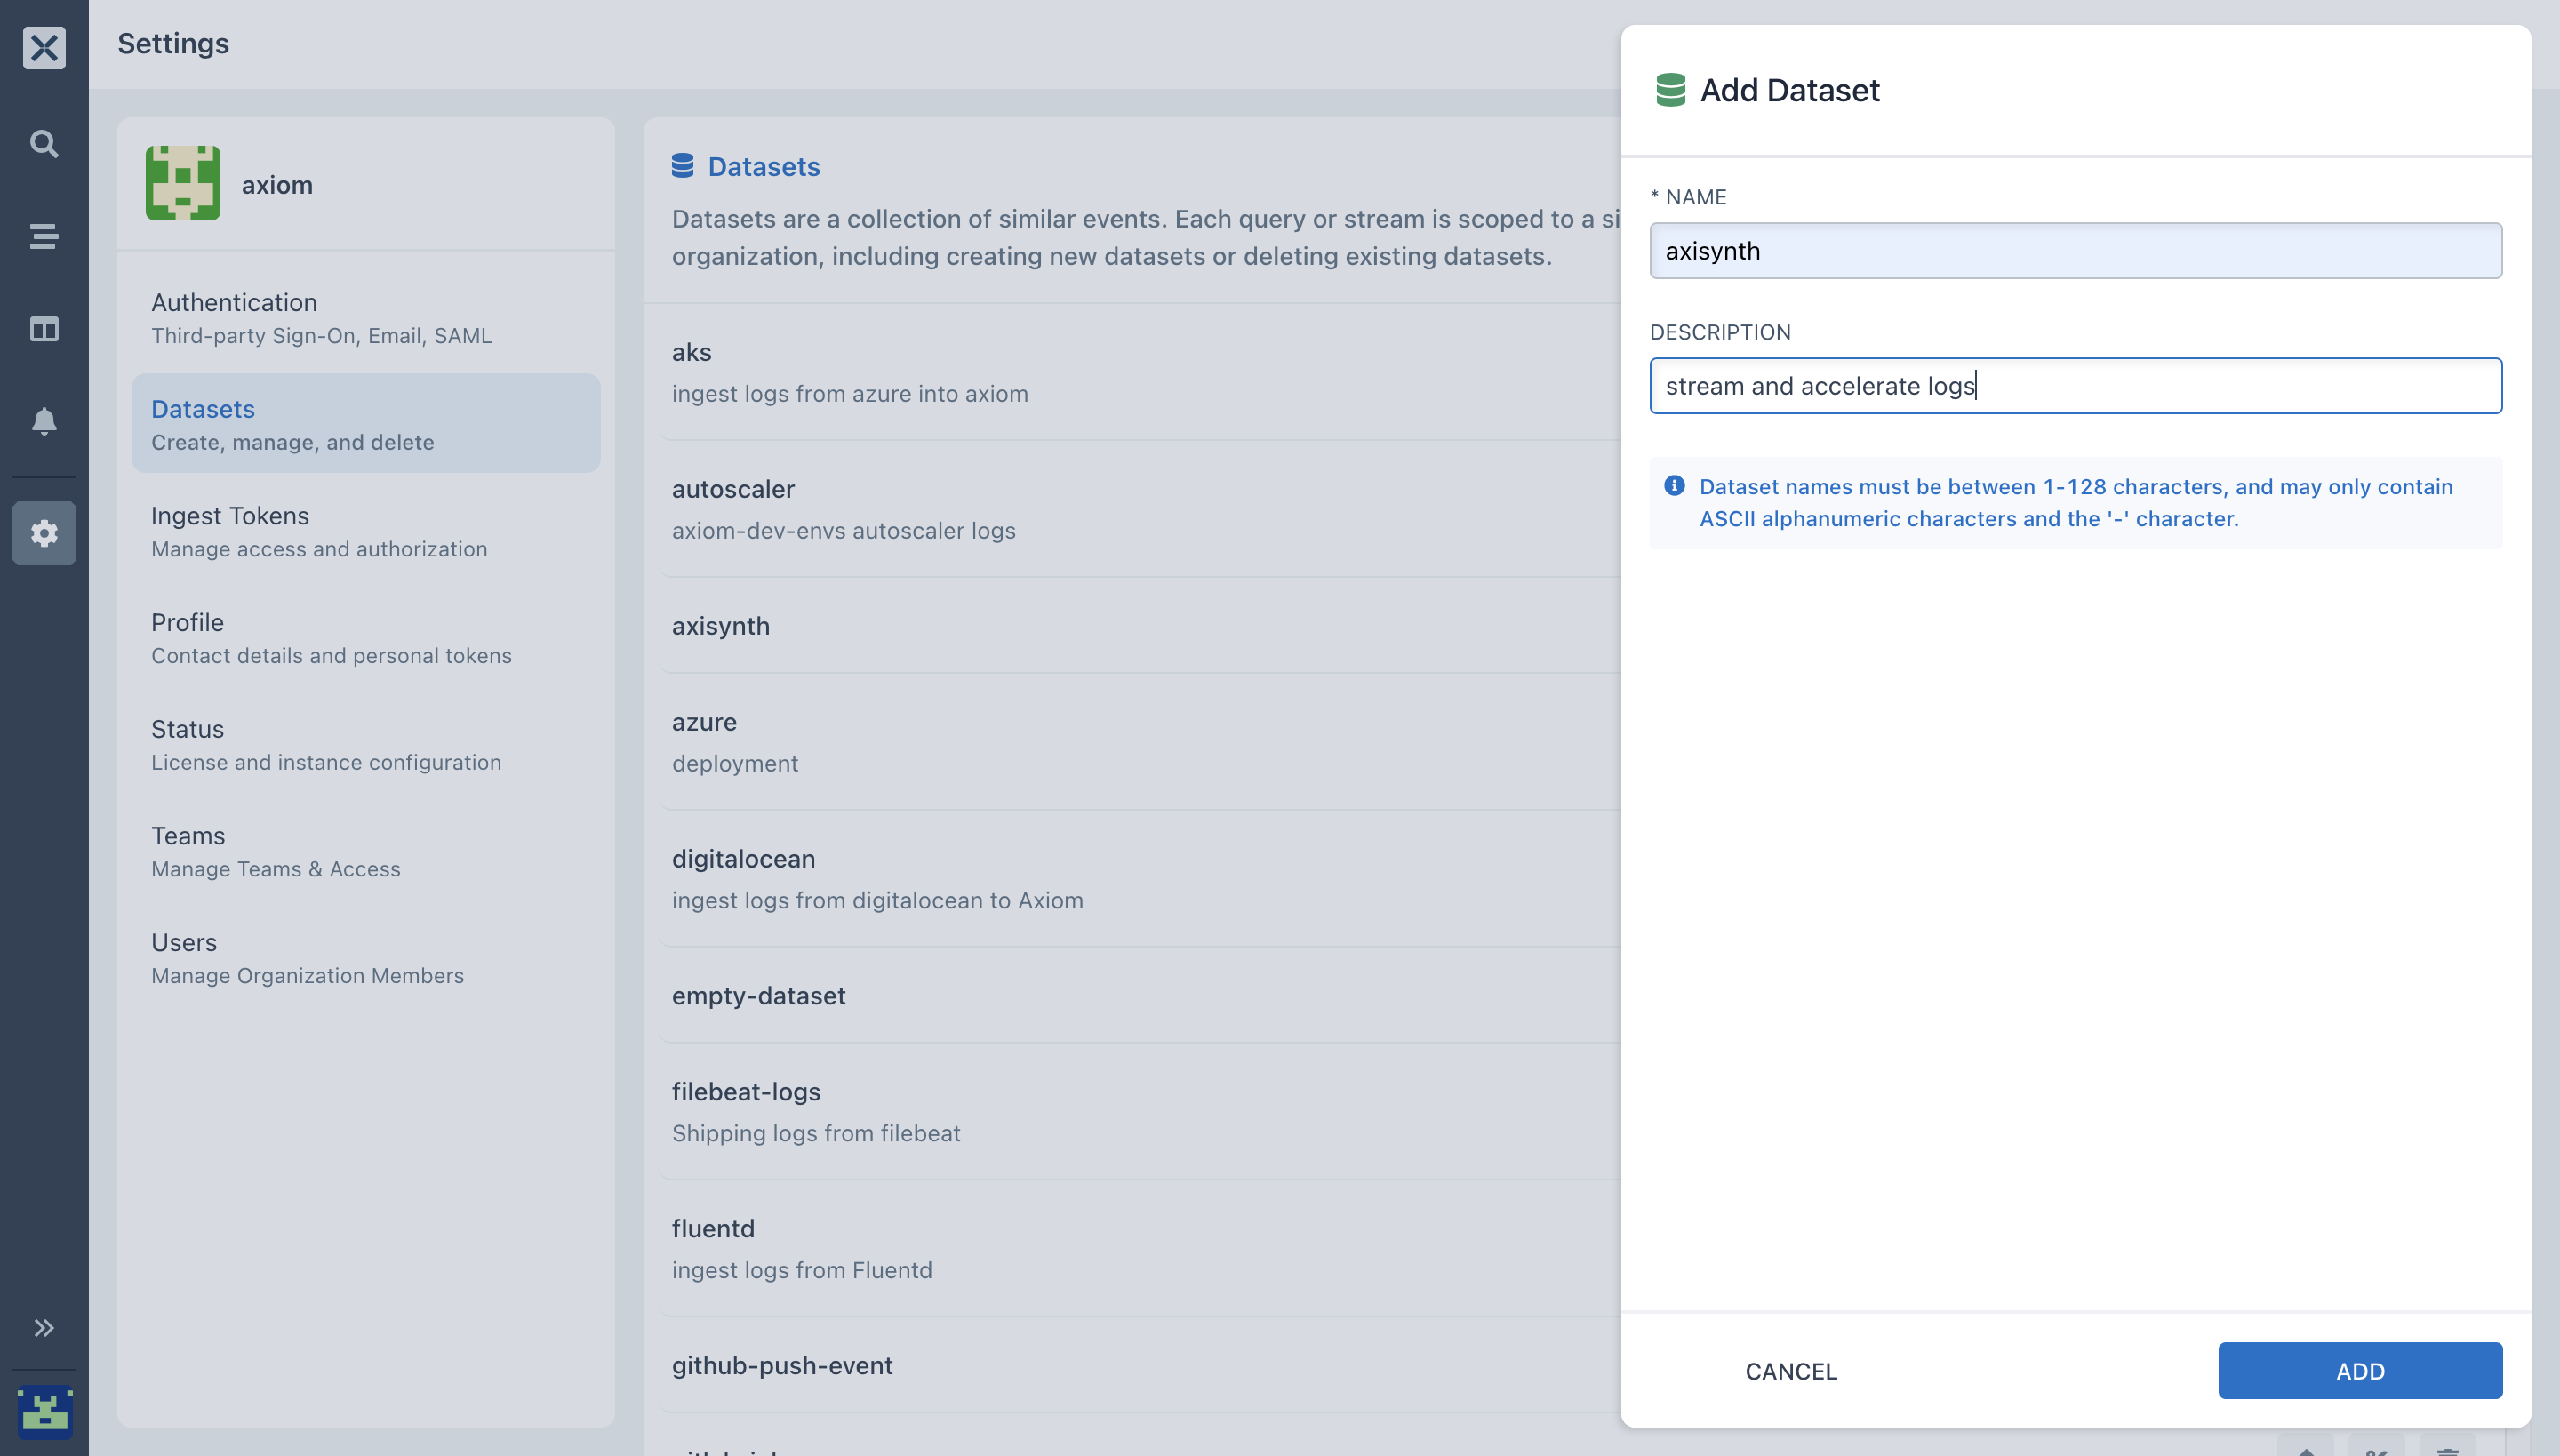
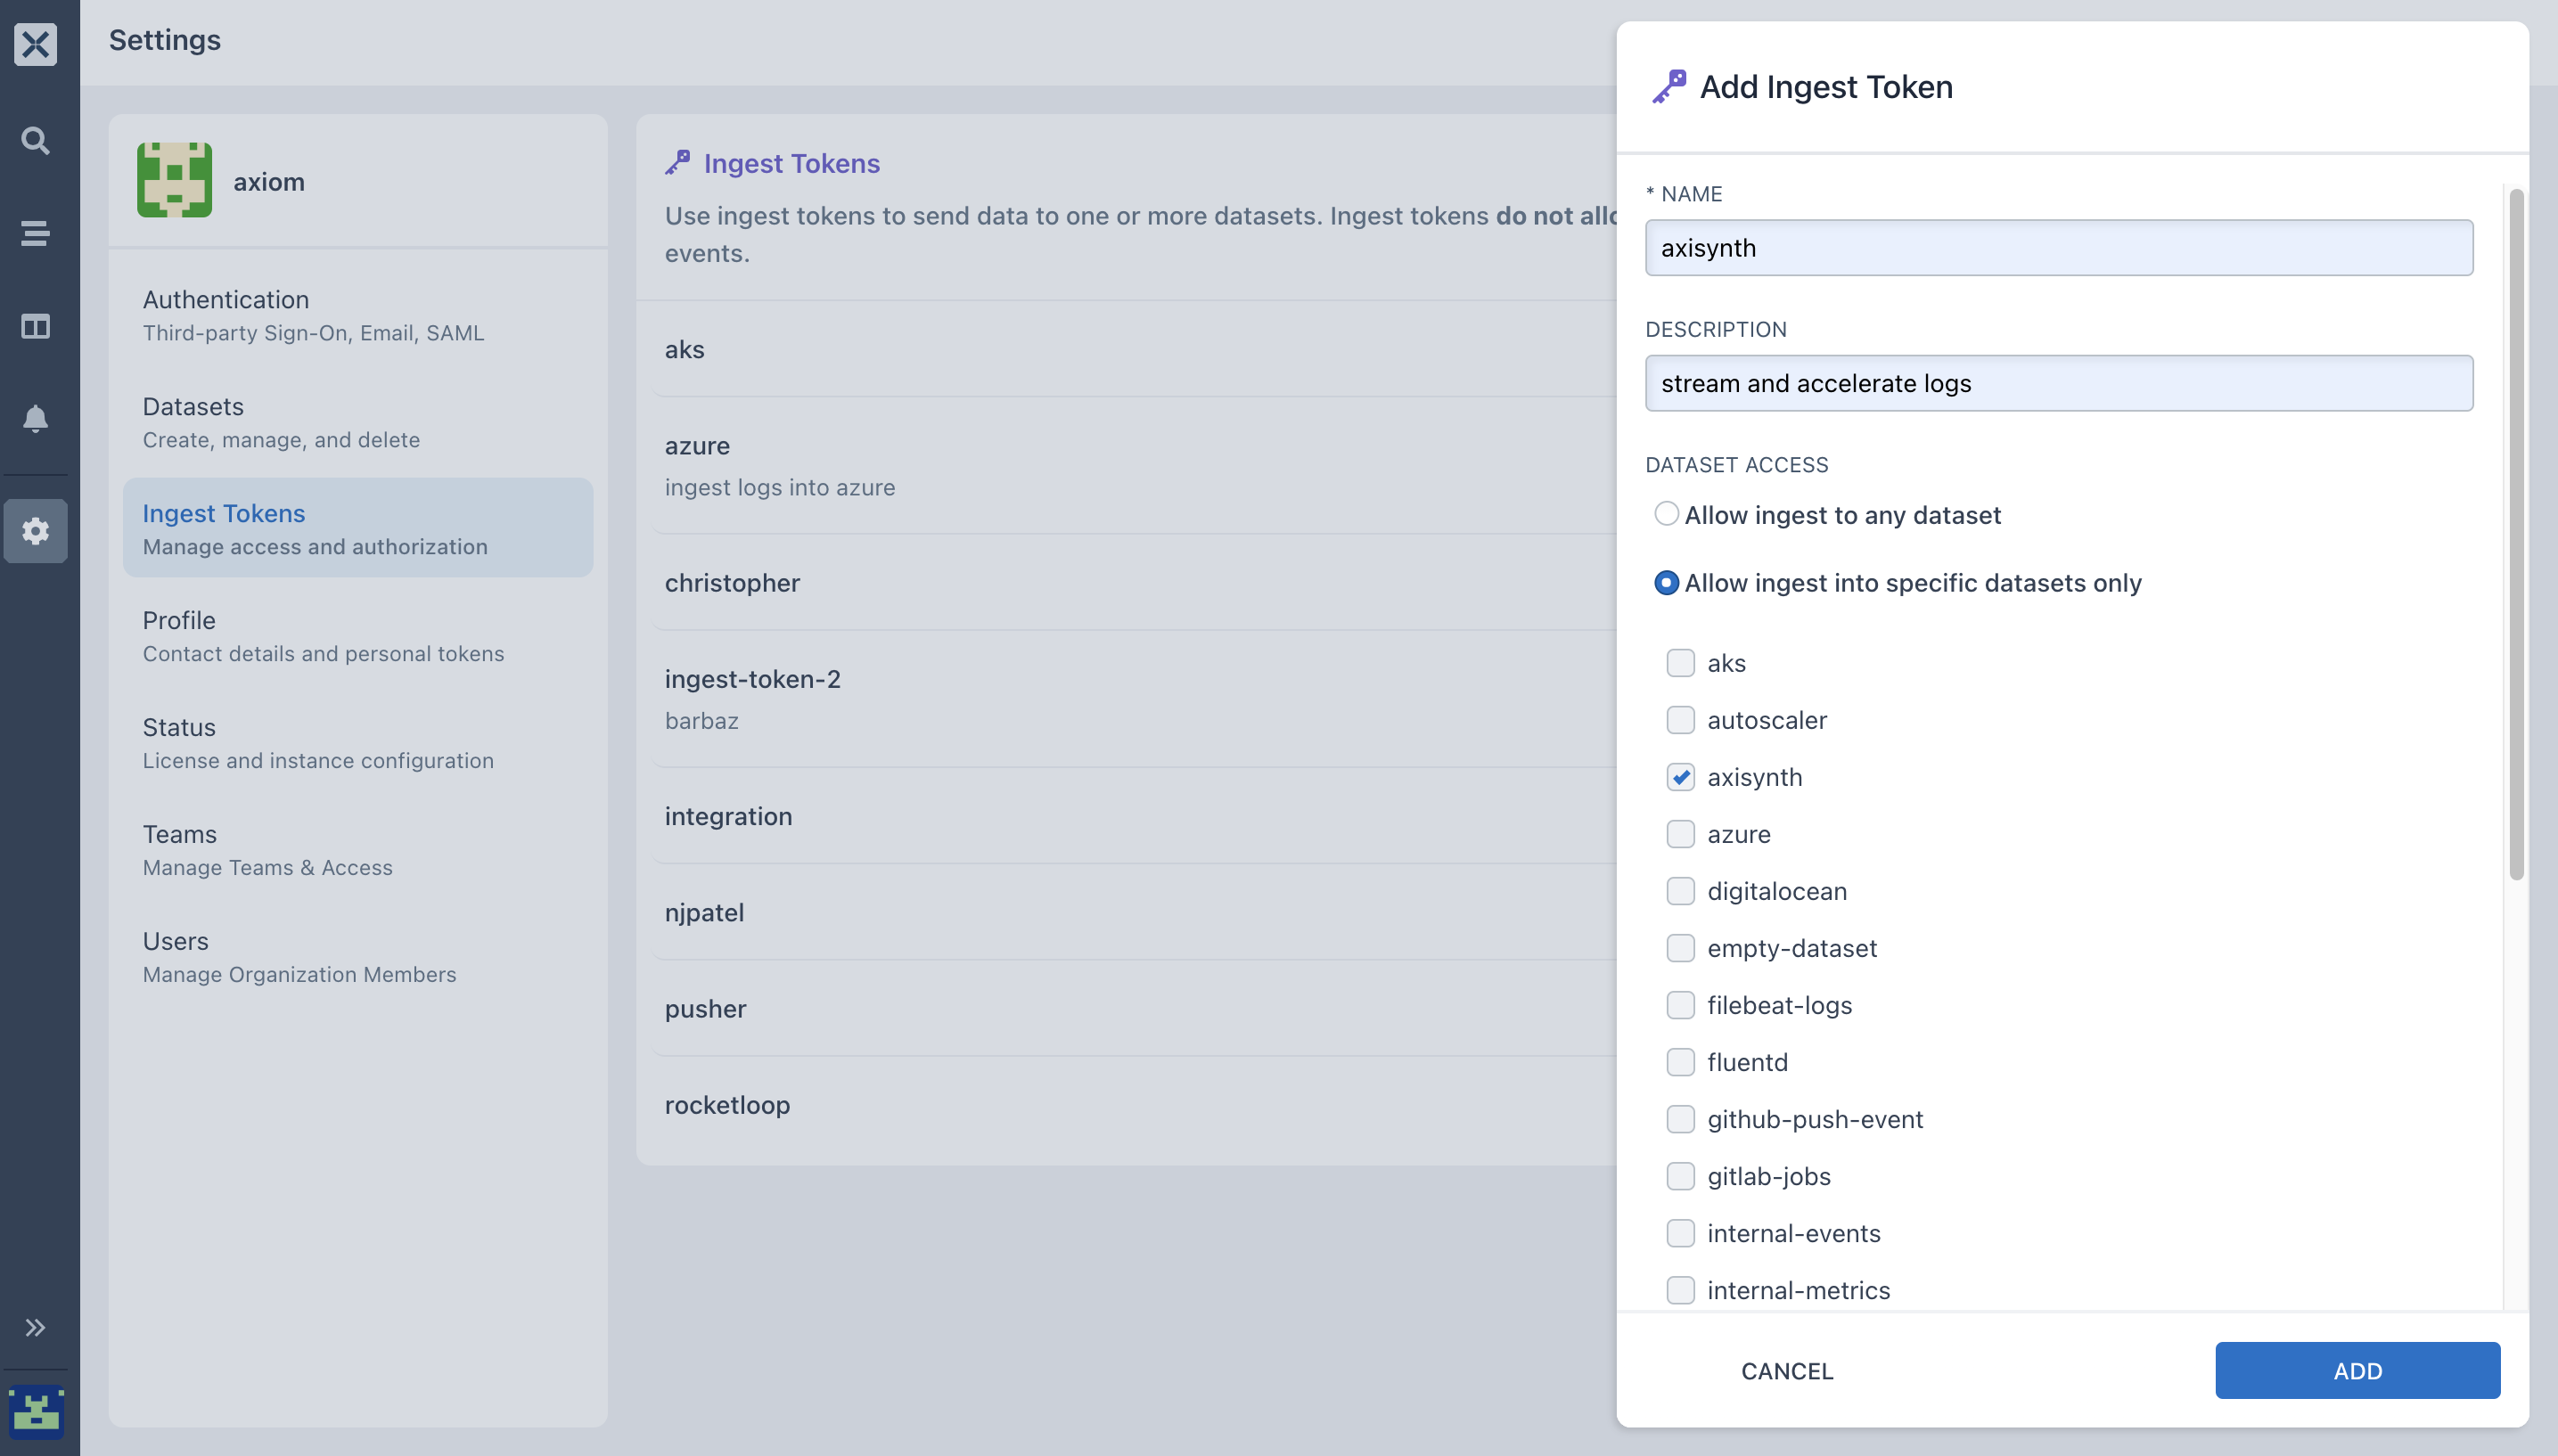
- Generate your ingest token, this will let you send data to one or more datasets which the token is configured for.
- On the Axiom UI, click on settings, select ingest token.
- Select Add ingest token.
- Enter a name and description and select ADD.
- Copy the generated token to your clipboard. Once you navigate from the page, the token can be seen again by selecting Ingest Tokens.
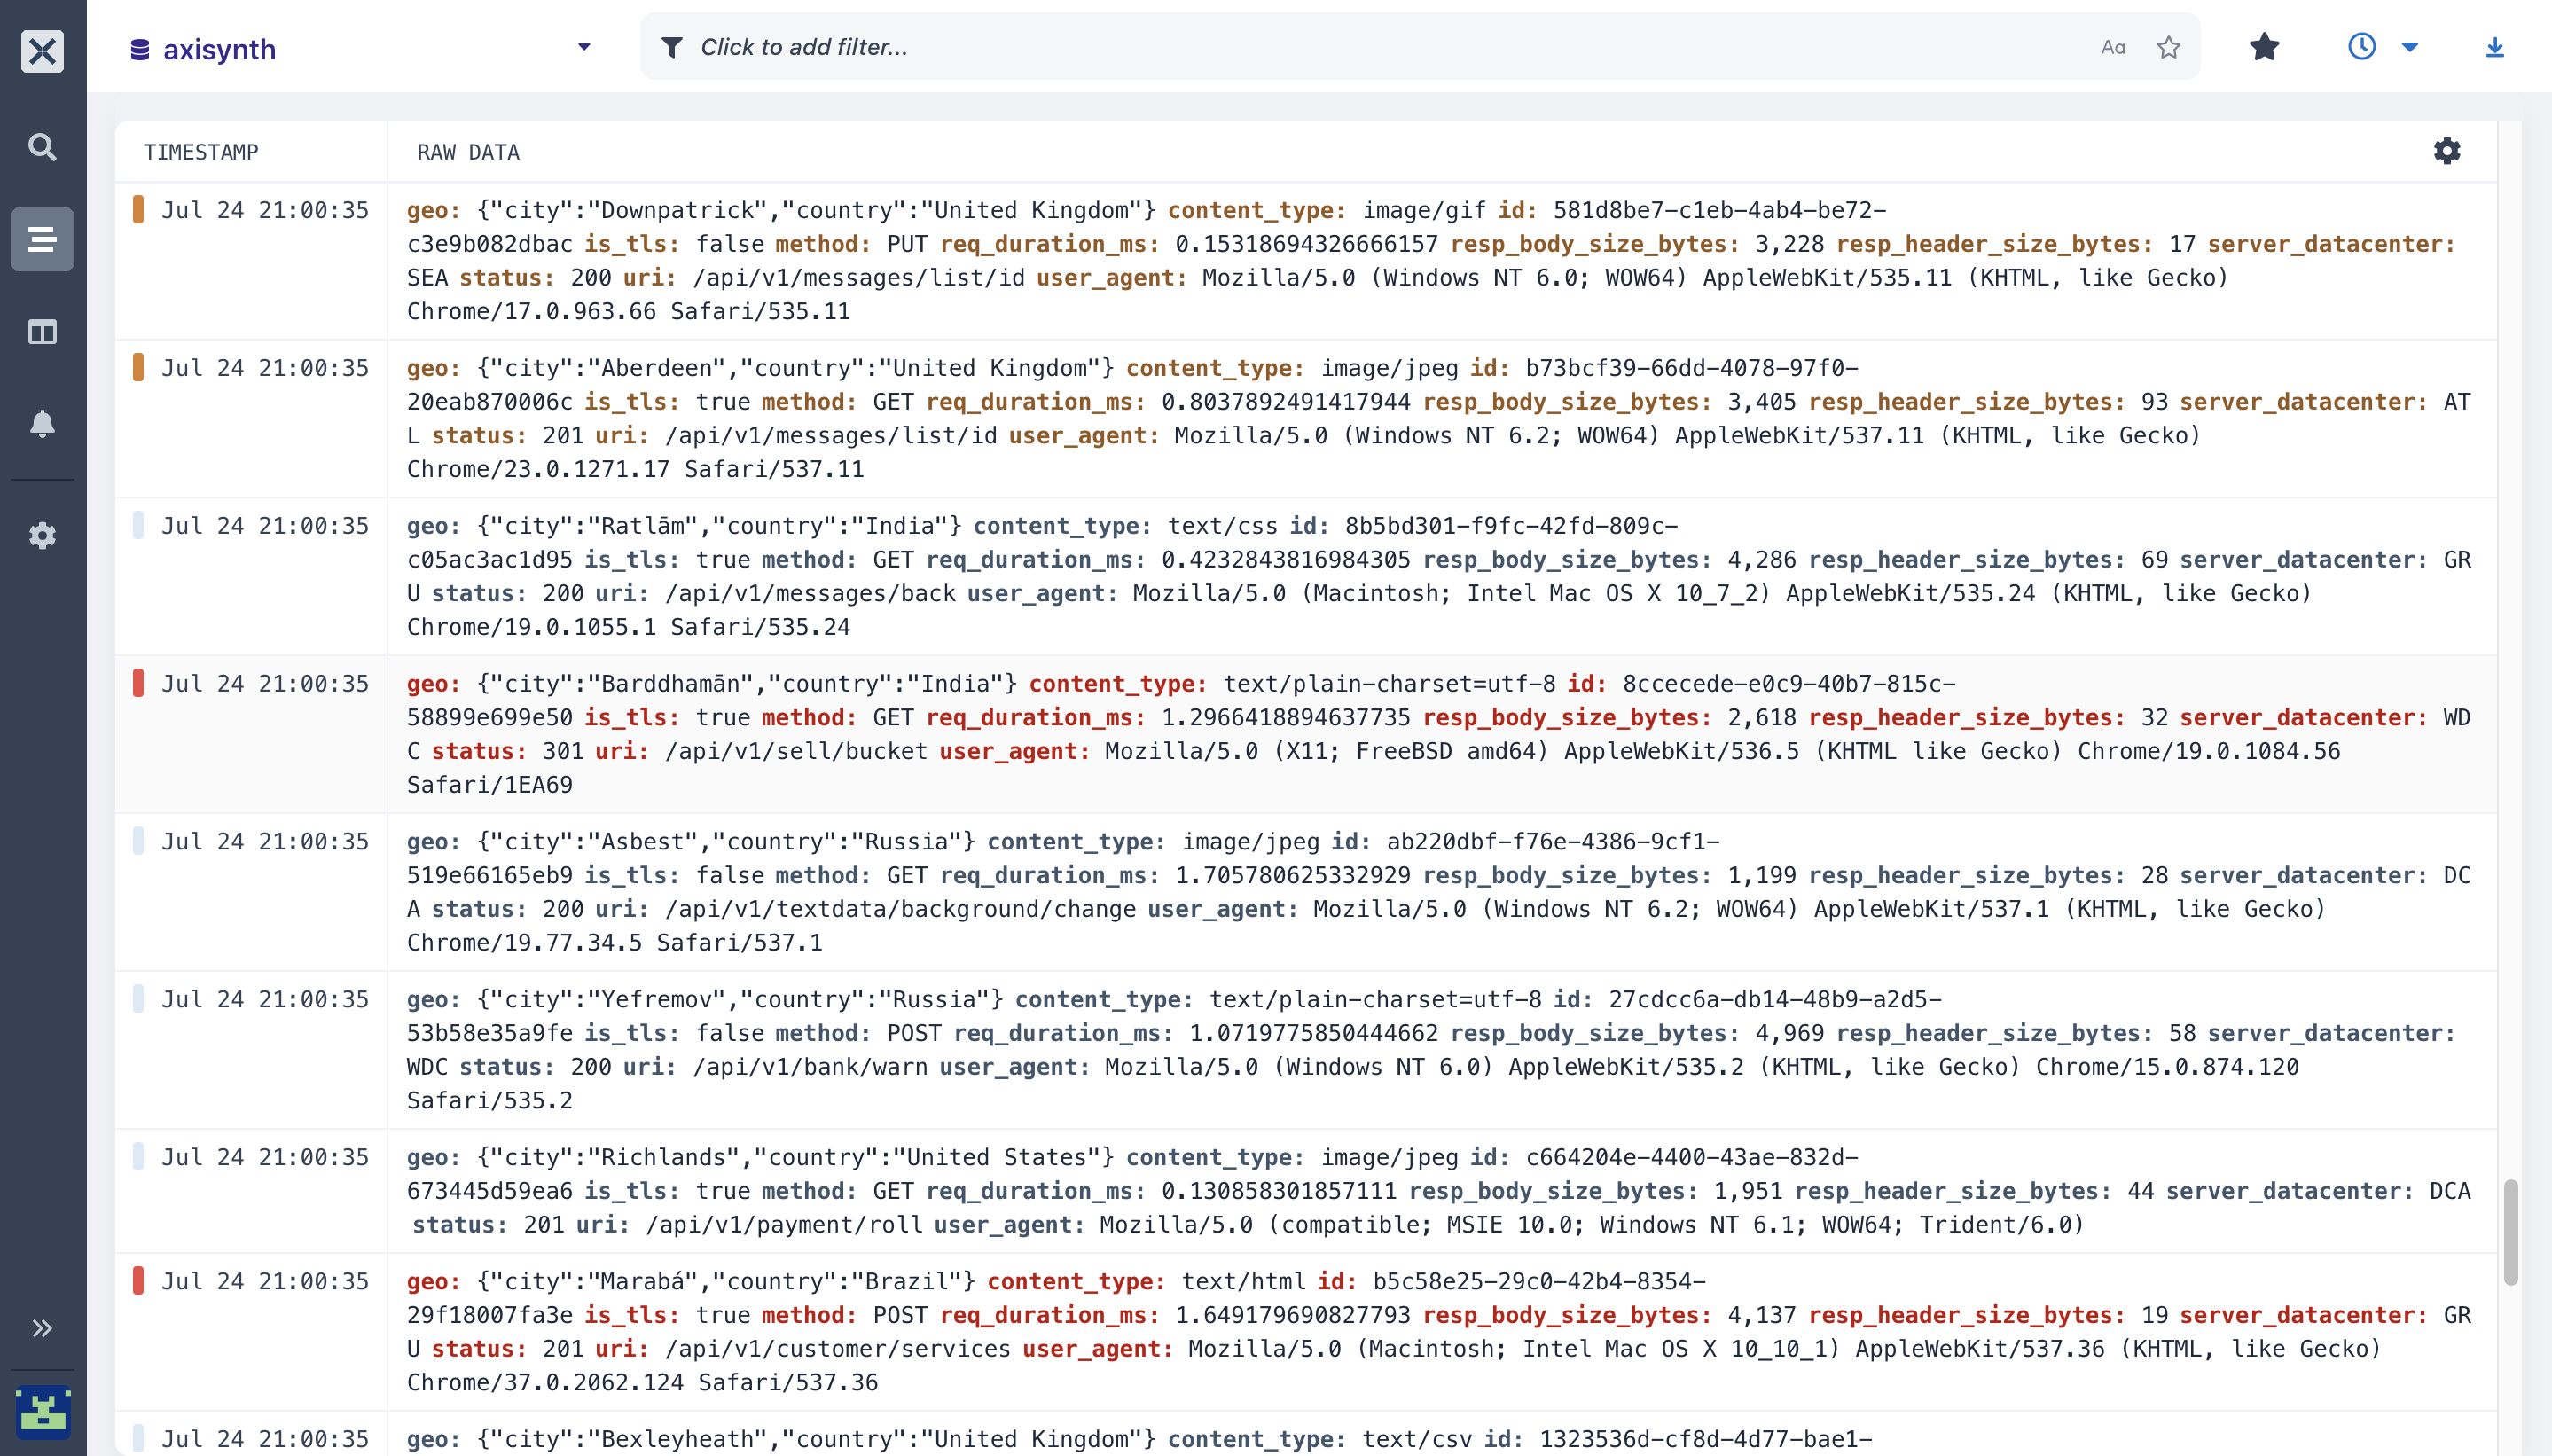
- Visit the stream page by selecting stream on the Axiom UI. With Axiom stream feature you can evaluate and diagnose massive amount of data from different sources simultaneously.
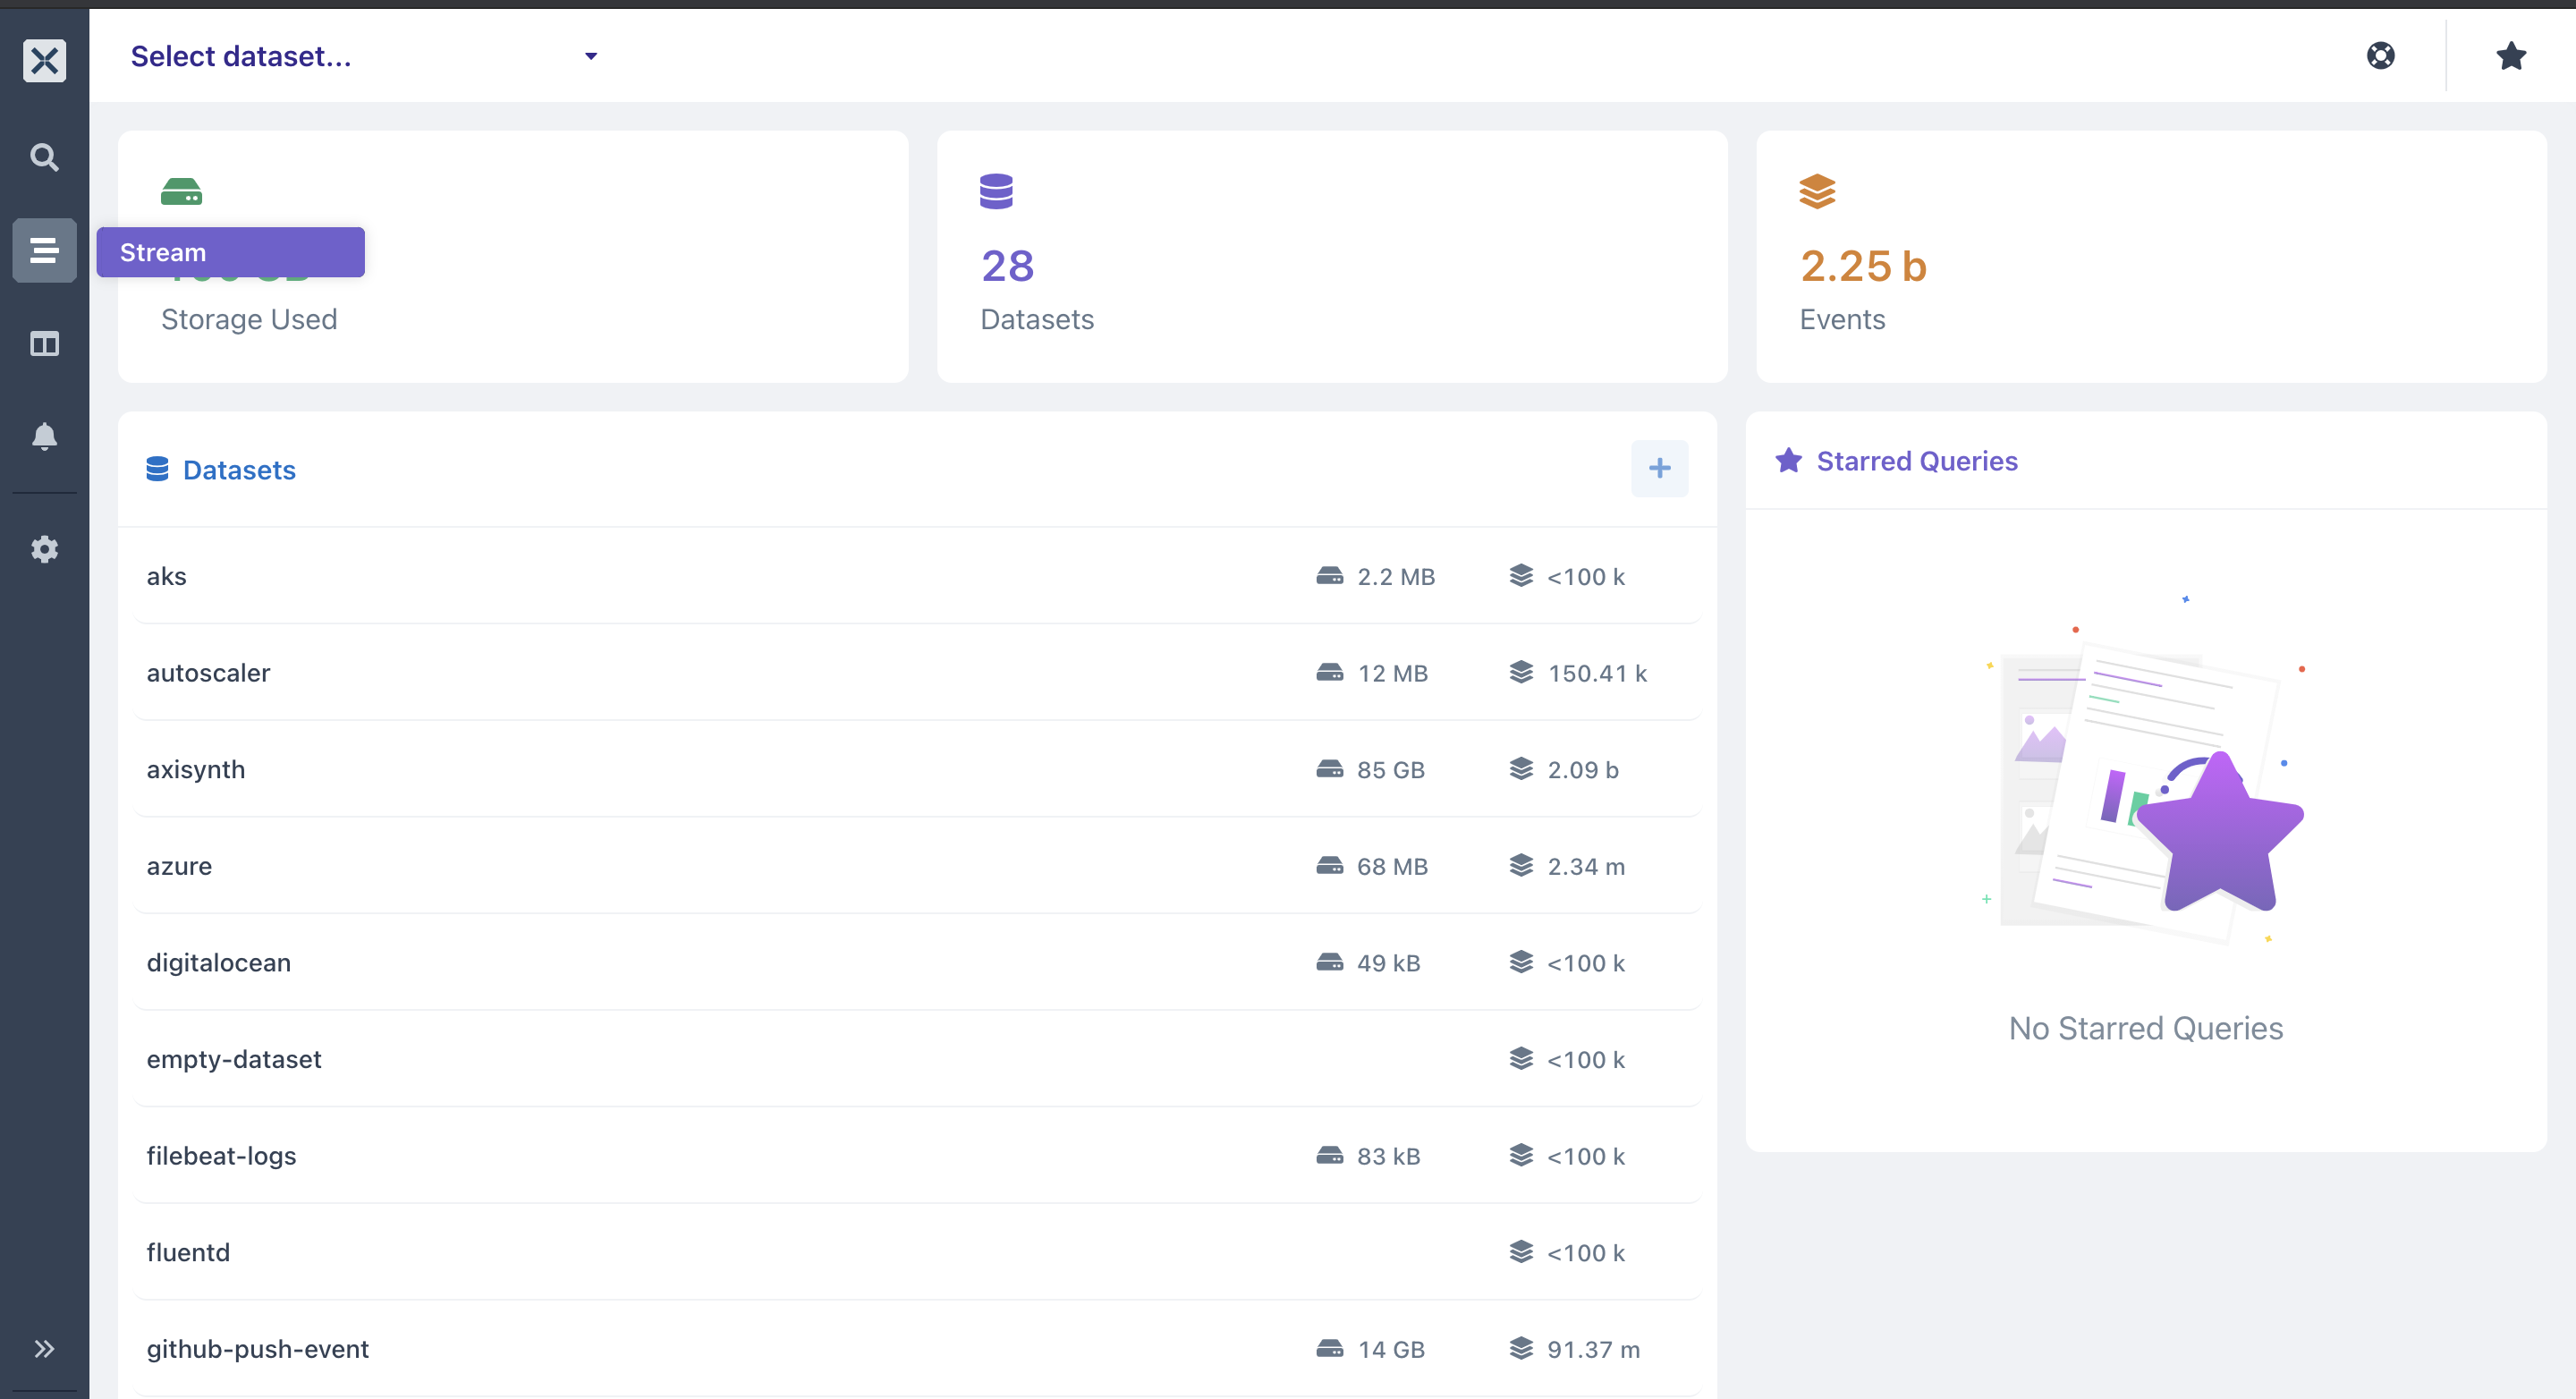
- Select your dataset, here I selected the
axisynthdataset which I created and ingested logs into instep 3
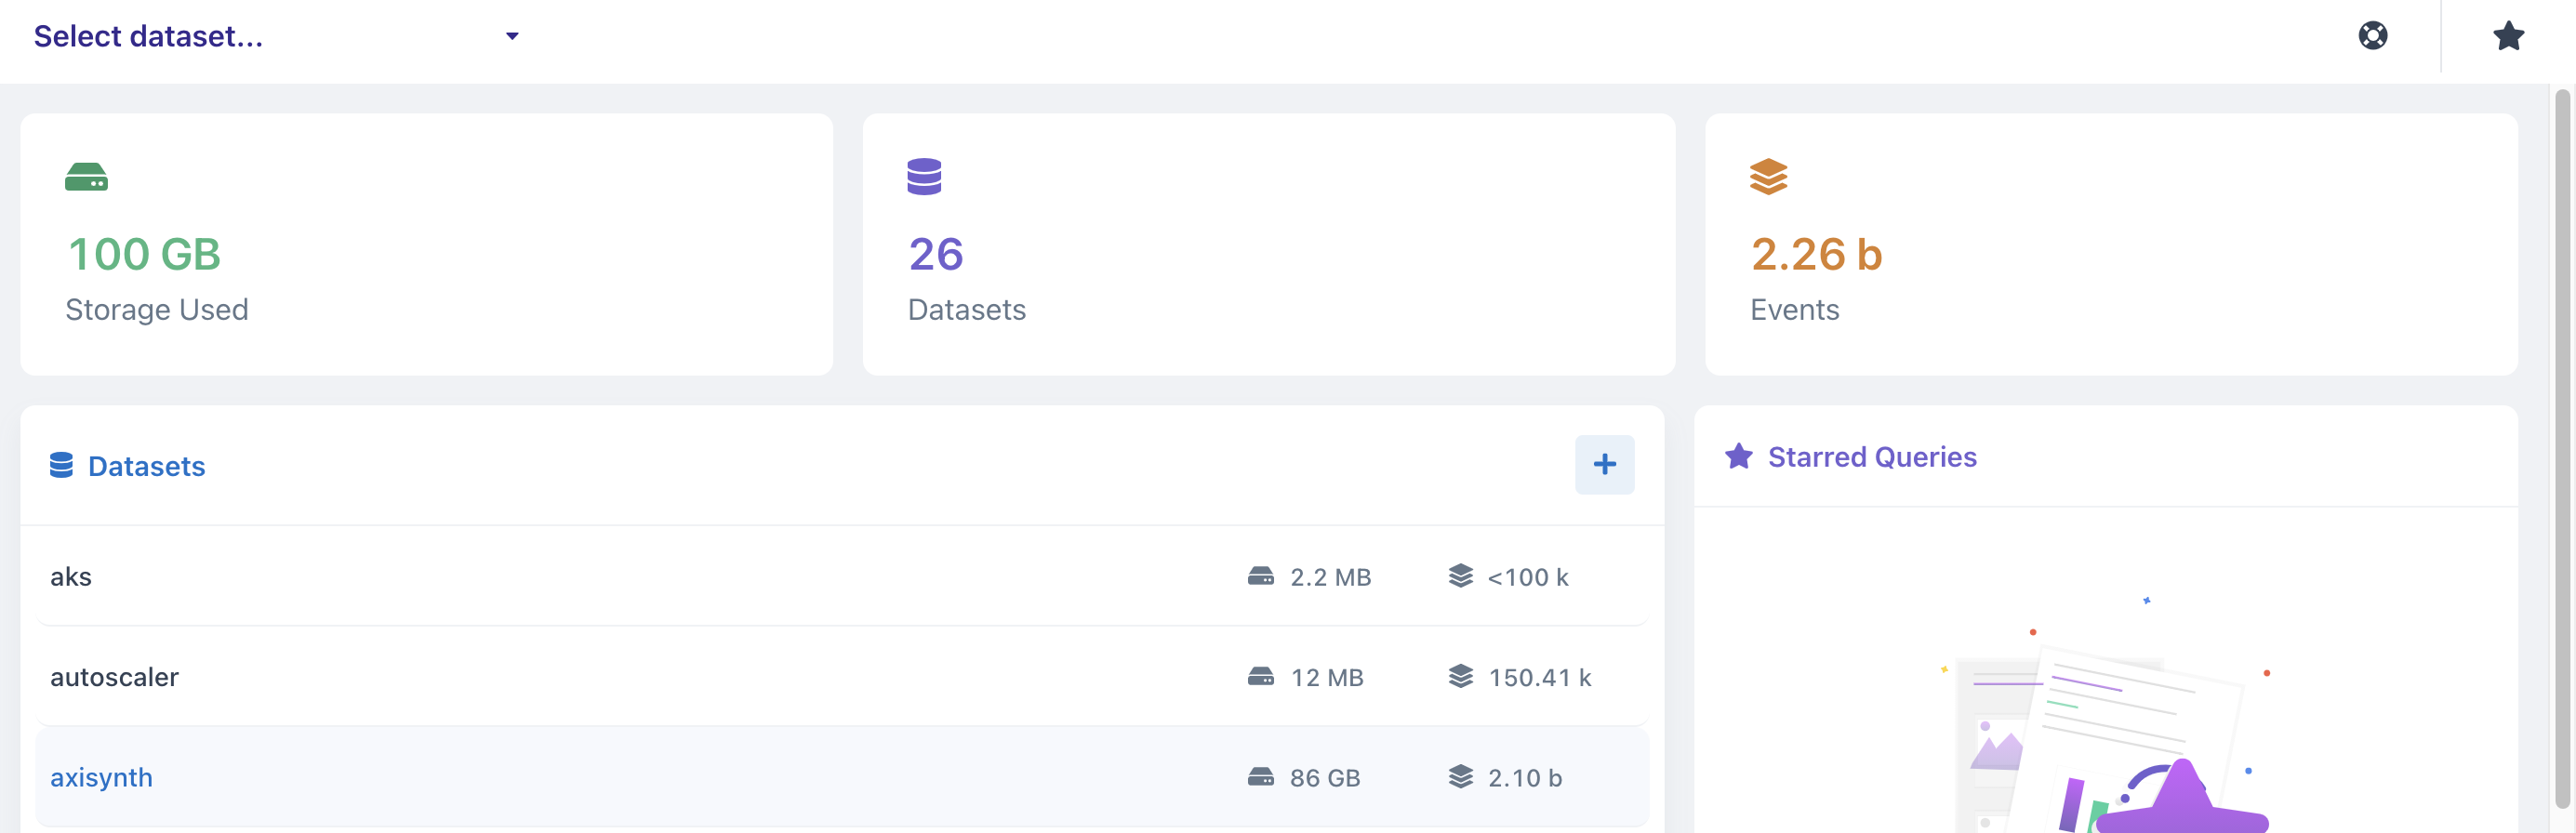
- You will see all your events that have been ingested or are currently being ingested into your dataset.
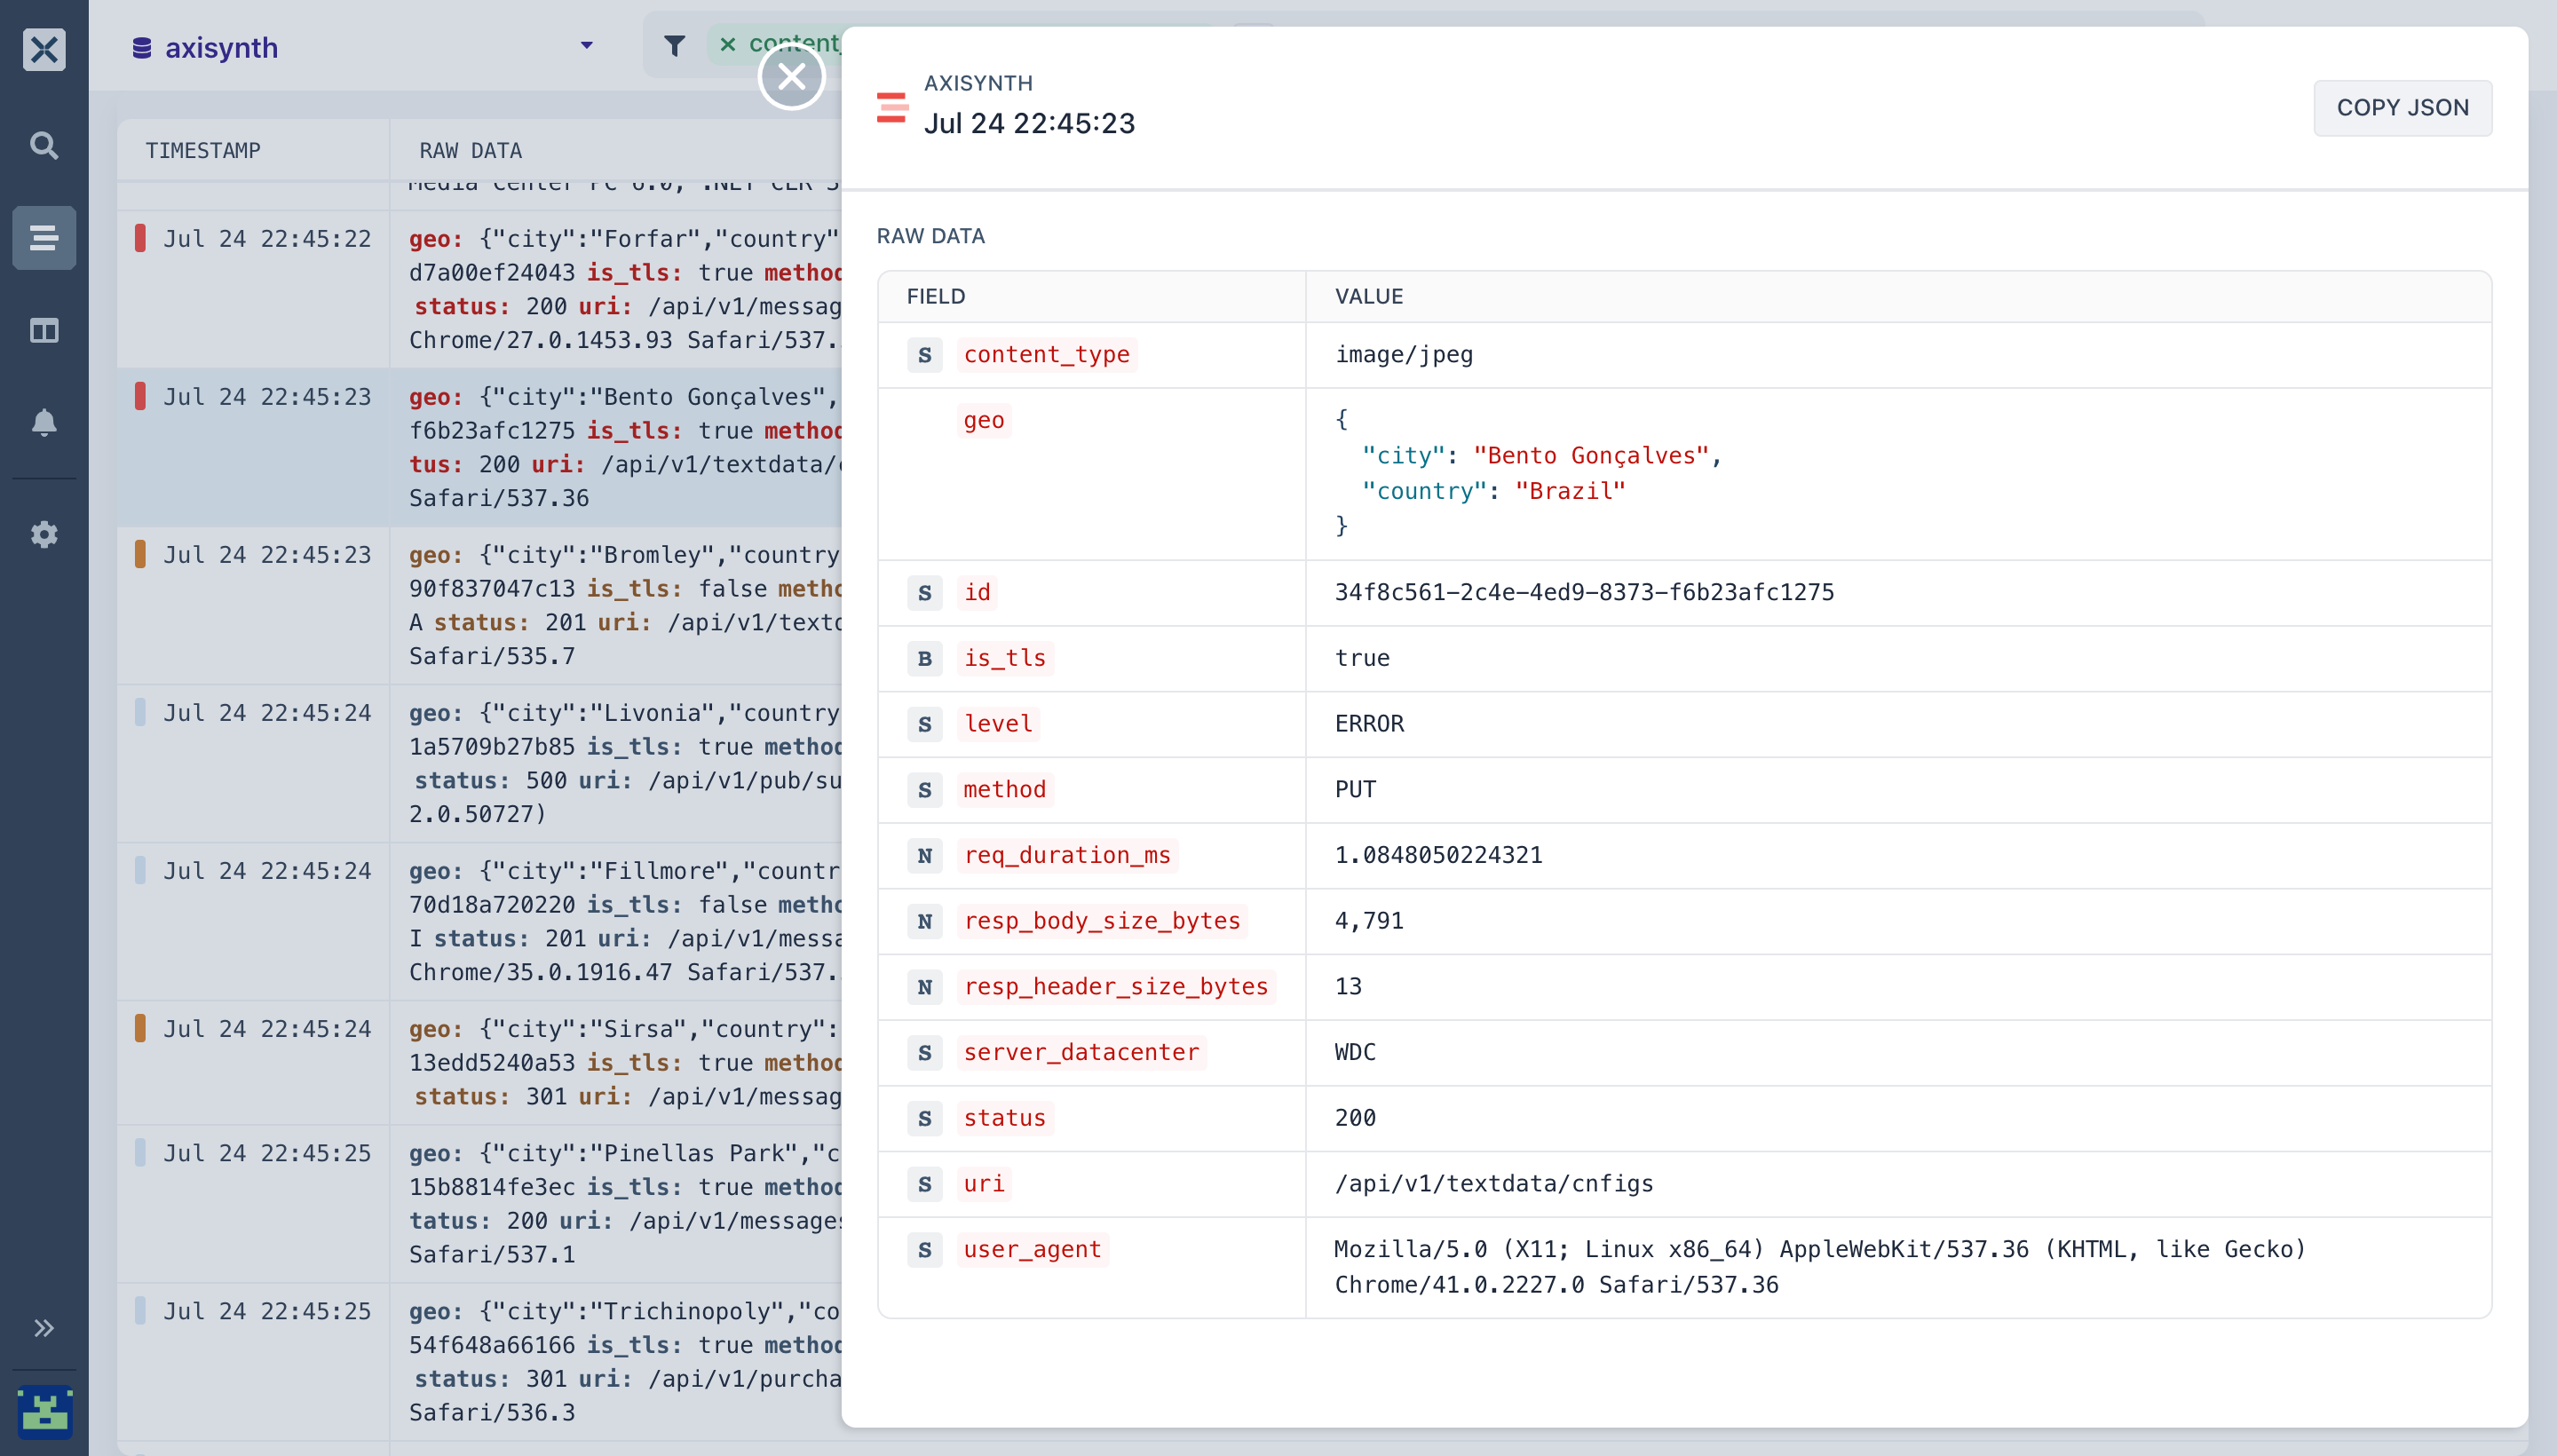
- When you click on a particular event, you will be taken to the event details Click on an event to be taken to the event details feed:
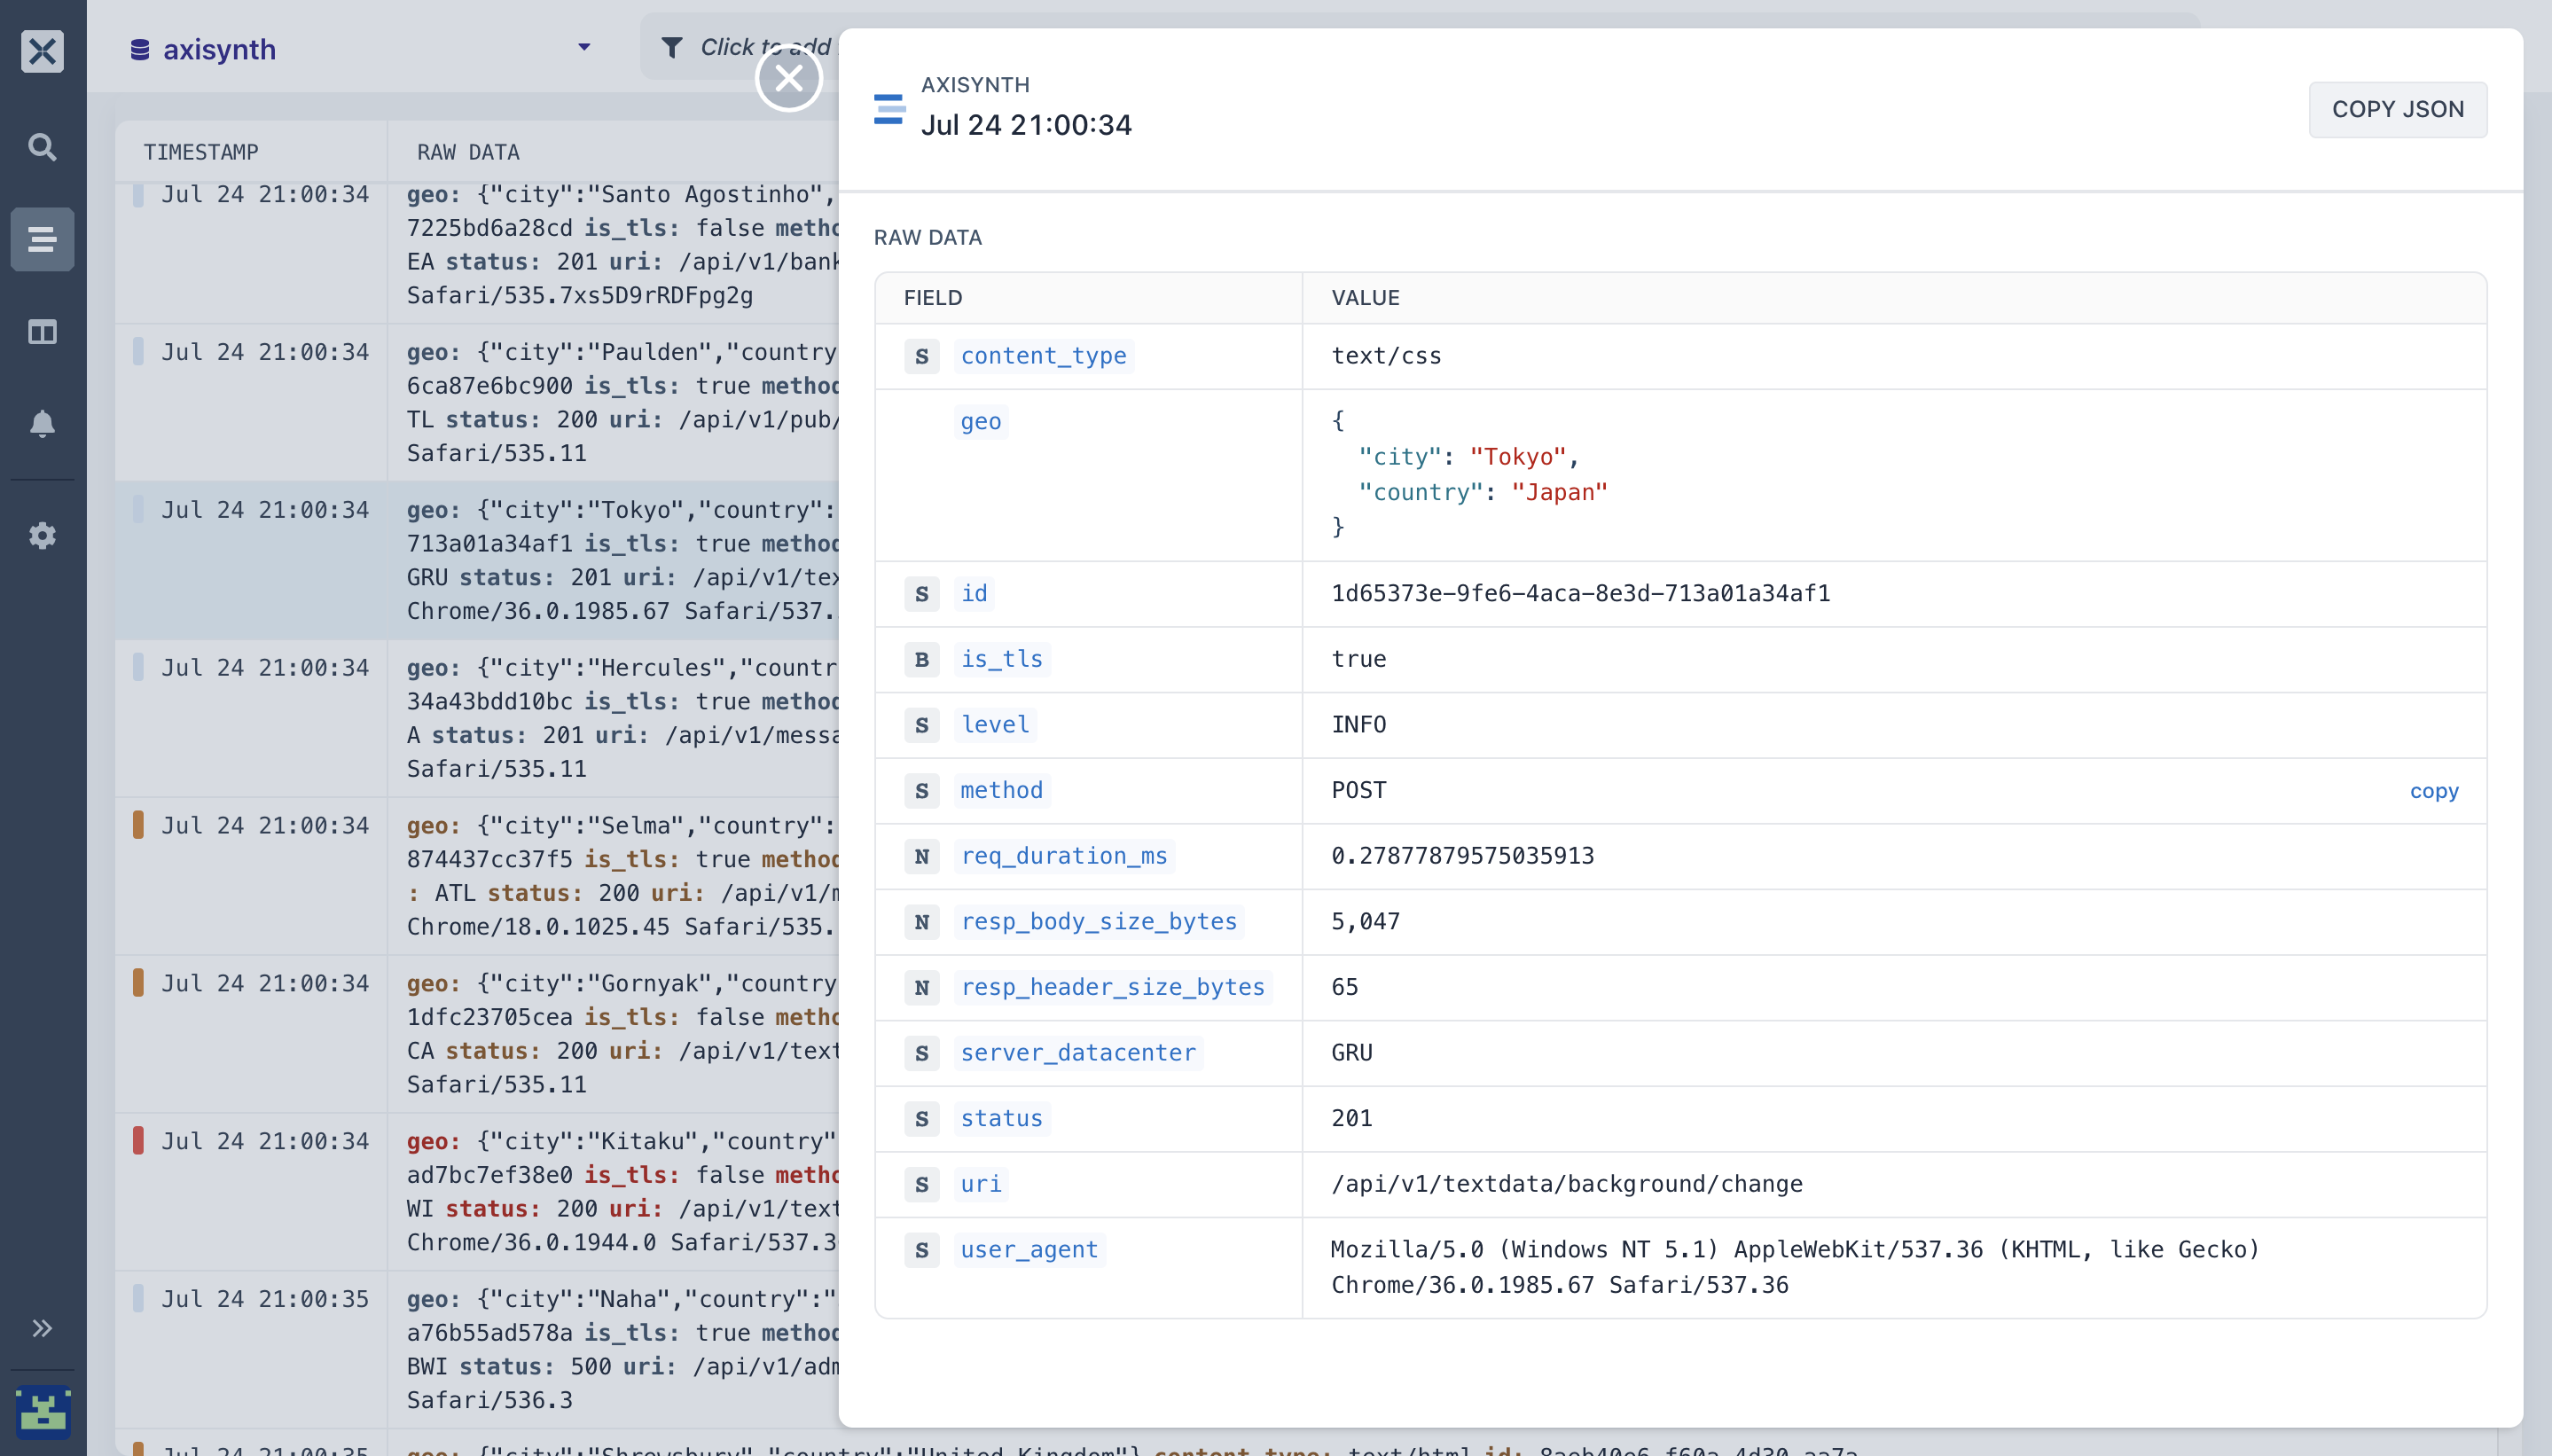
In your event details feed, you can copy the entire event as JSON by selecting COPY JSON on the far top right corner or you can copy each individual FIELD/VALUE
- After viewing and copying each individual stream from your dataset, you can create powerful filters on your streams. With these stream filters, you can separate your events, modify your field results to suit your resource needs and add different operators to your individual field clause to get the specific value of what is going on in the context of your entire system.
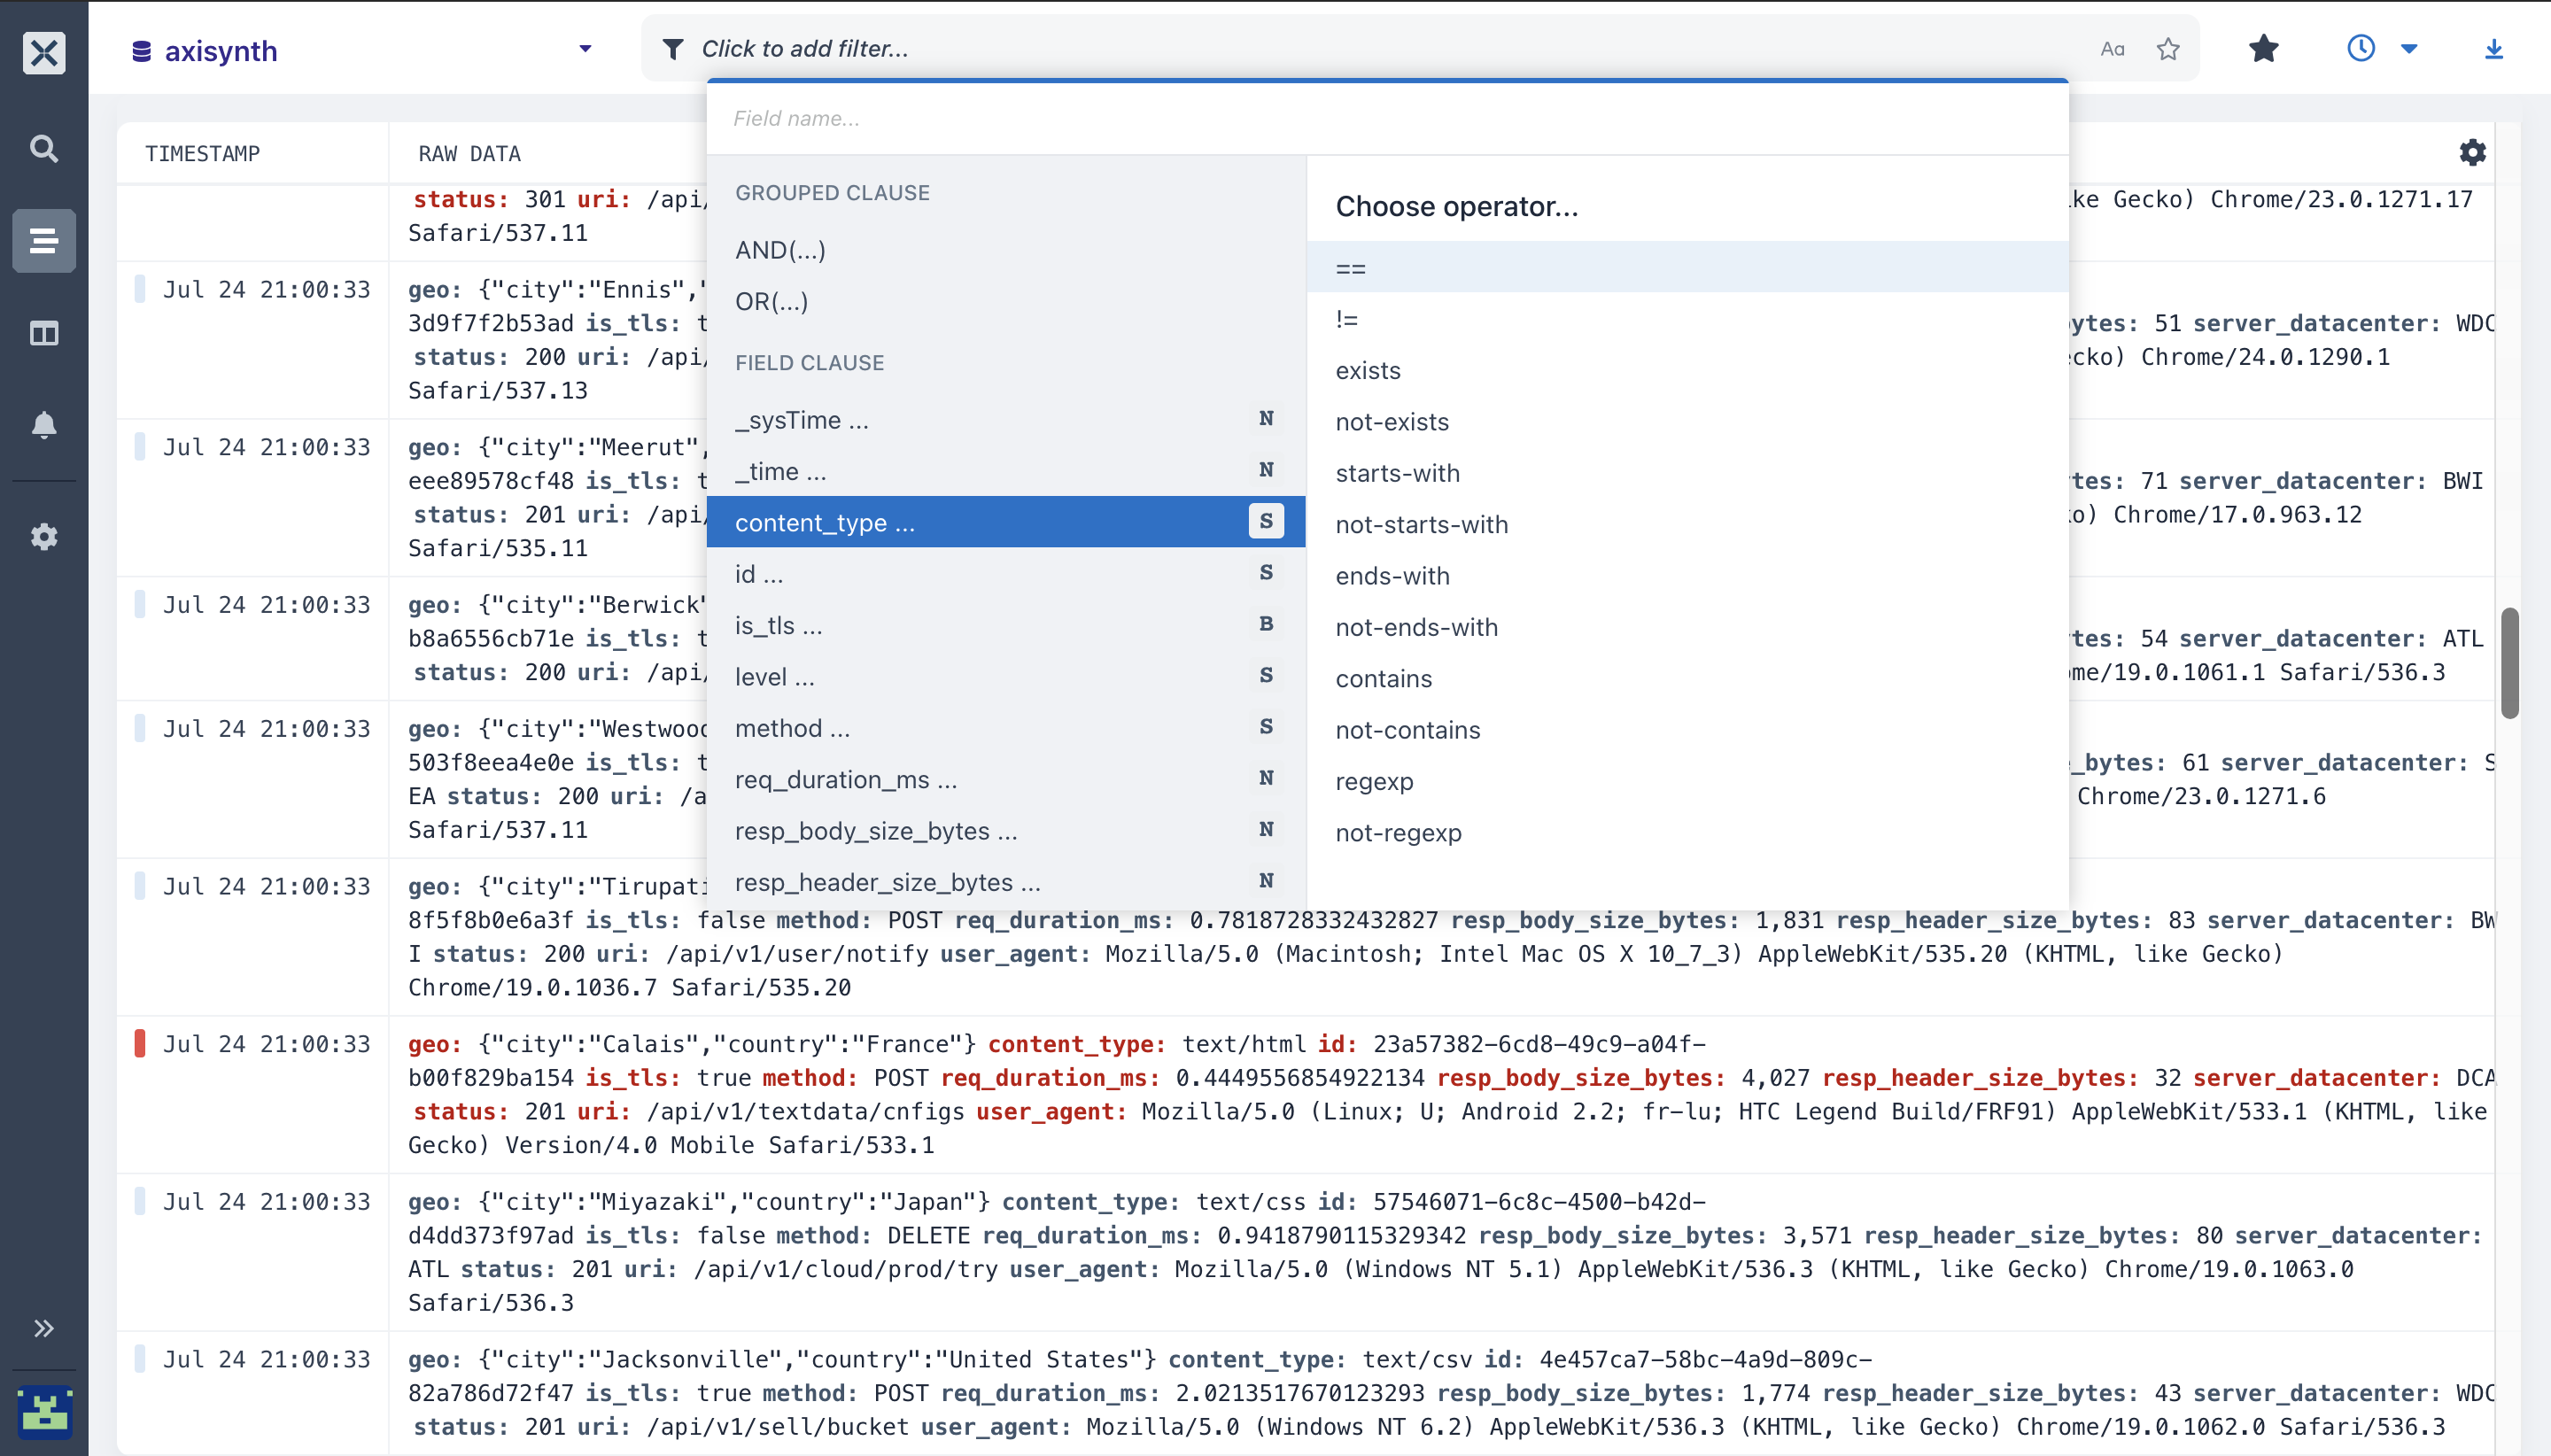
- Here, I want to get the specific group of events when my
FIELD CLAUSE VALUE(content_type)isimage/jpeg.To get this, choose the FIELD CLAUSE which iscontent_type, select thestarts-withoperator and input the valueimage/jpeg
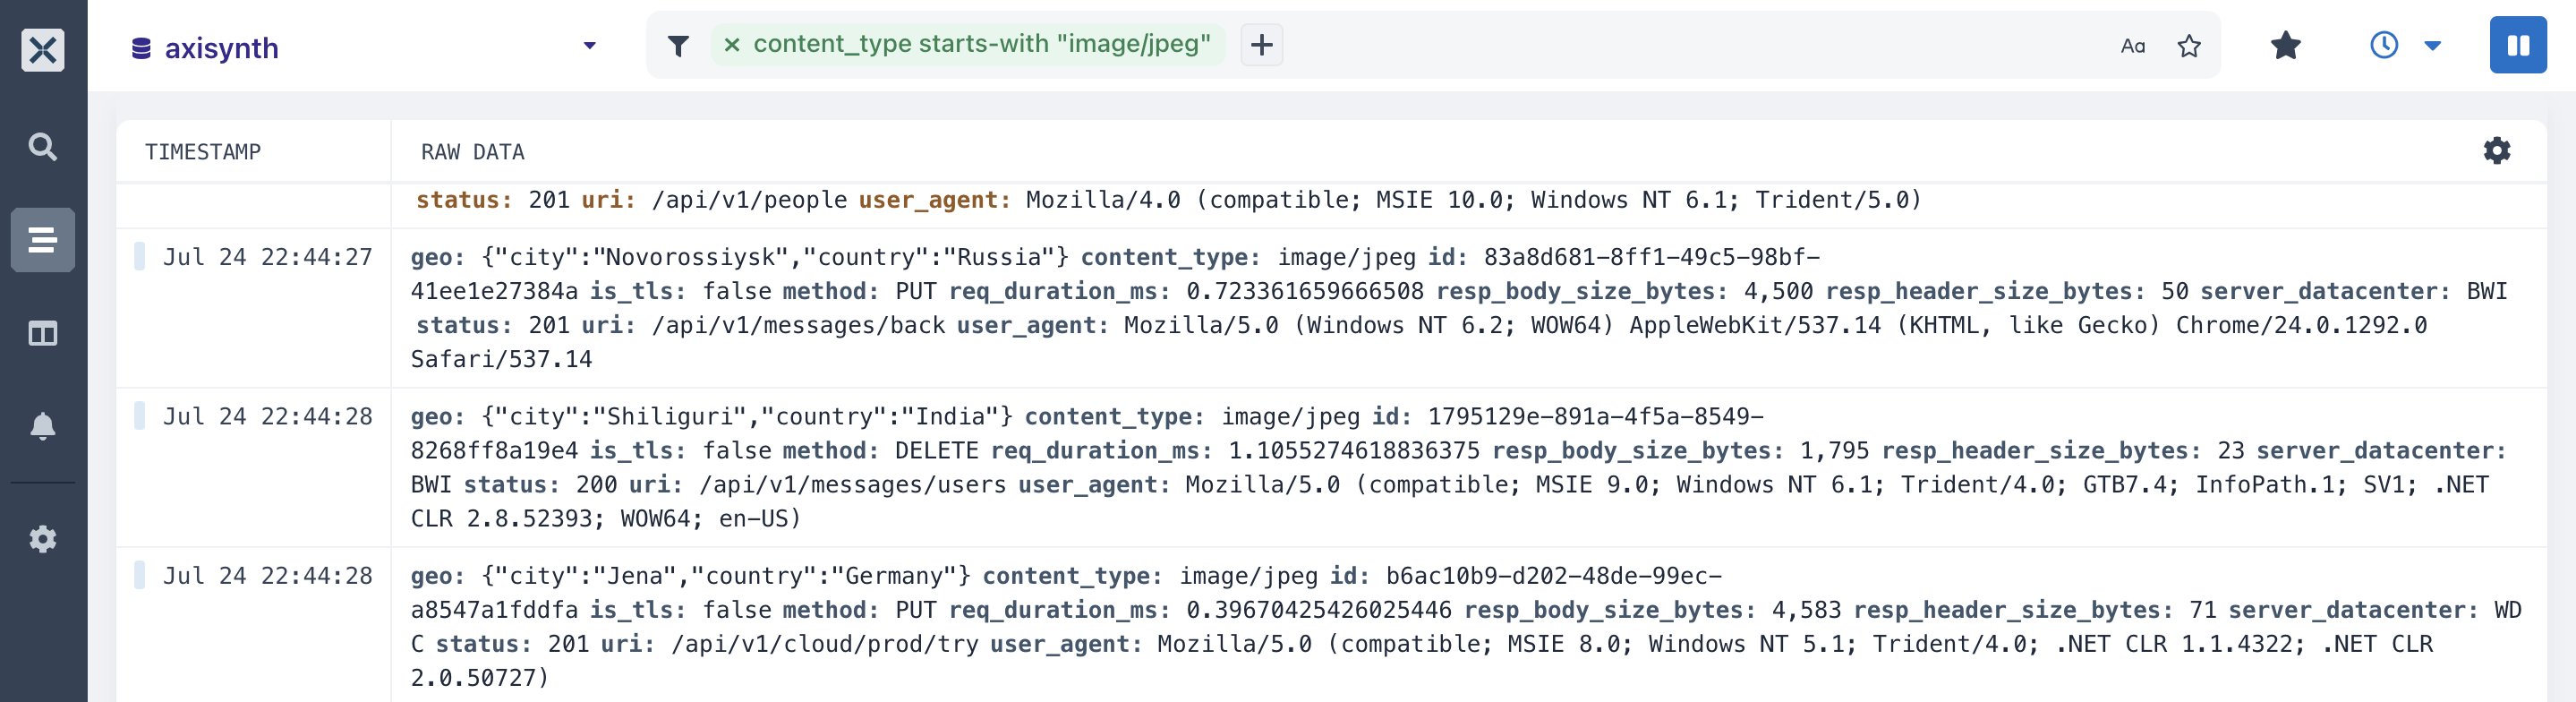
- Wait for the Filter builder to load, you will see all the events that start with
image/jpegwhen you open it. With this, you can run filters on your individual events to get the specific details from your resource logs.
- You can add more filters by clicking on the (+) sign. Choose your
FIELD CLAUSE, select the filter operator you want to work with, input the field value and run the filter builder.
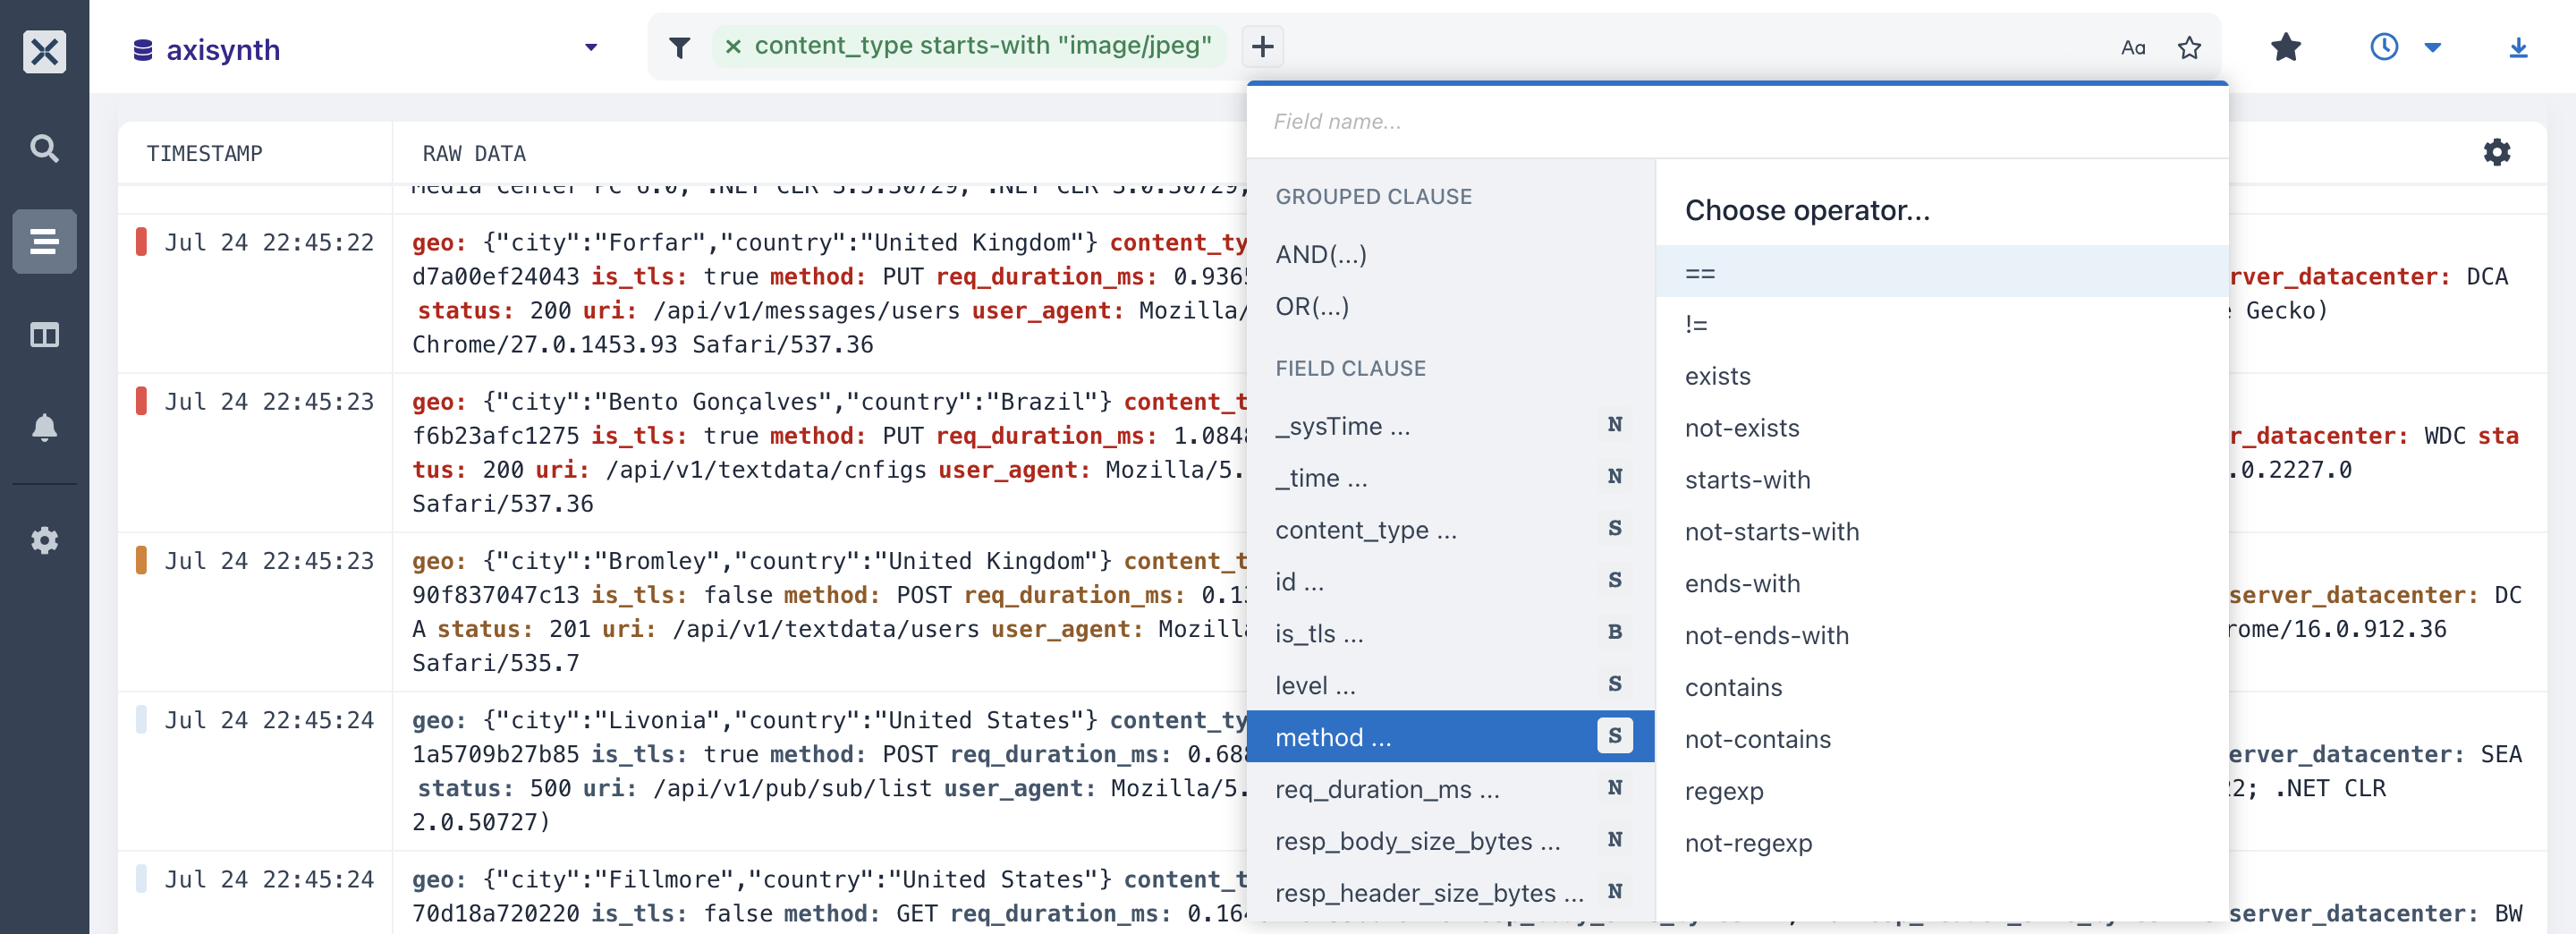
- Here, I want to get the series of events that occurred when my
methodFIELD CLAUSEends-withDELETEremember; we are adding this filter to the previous filter we ran in the previous step.

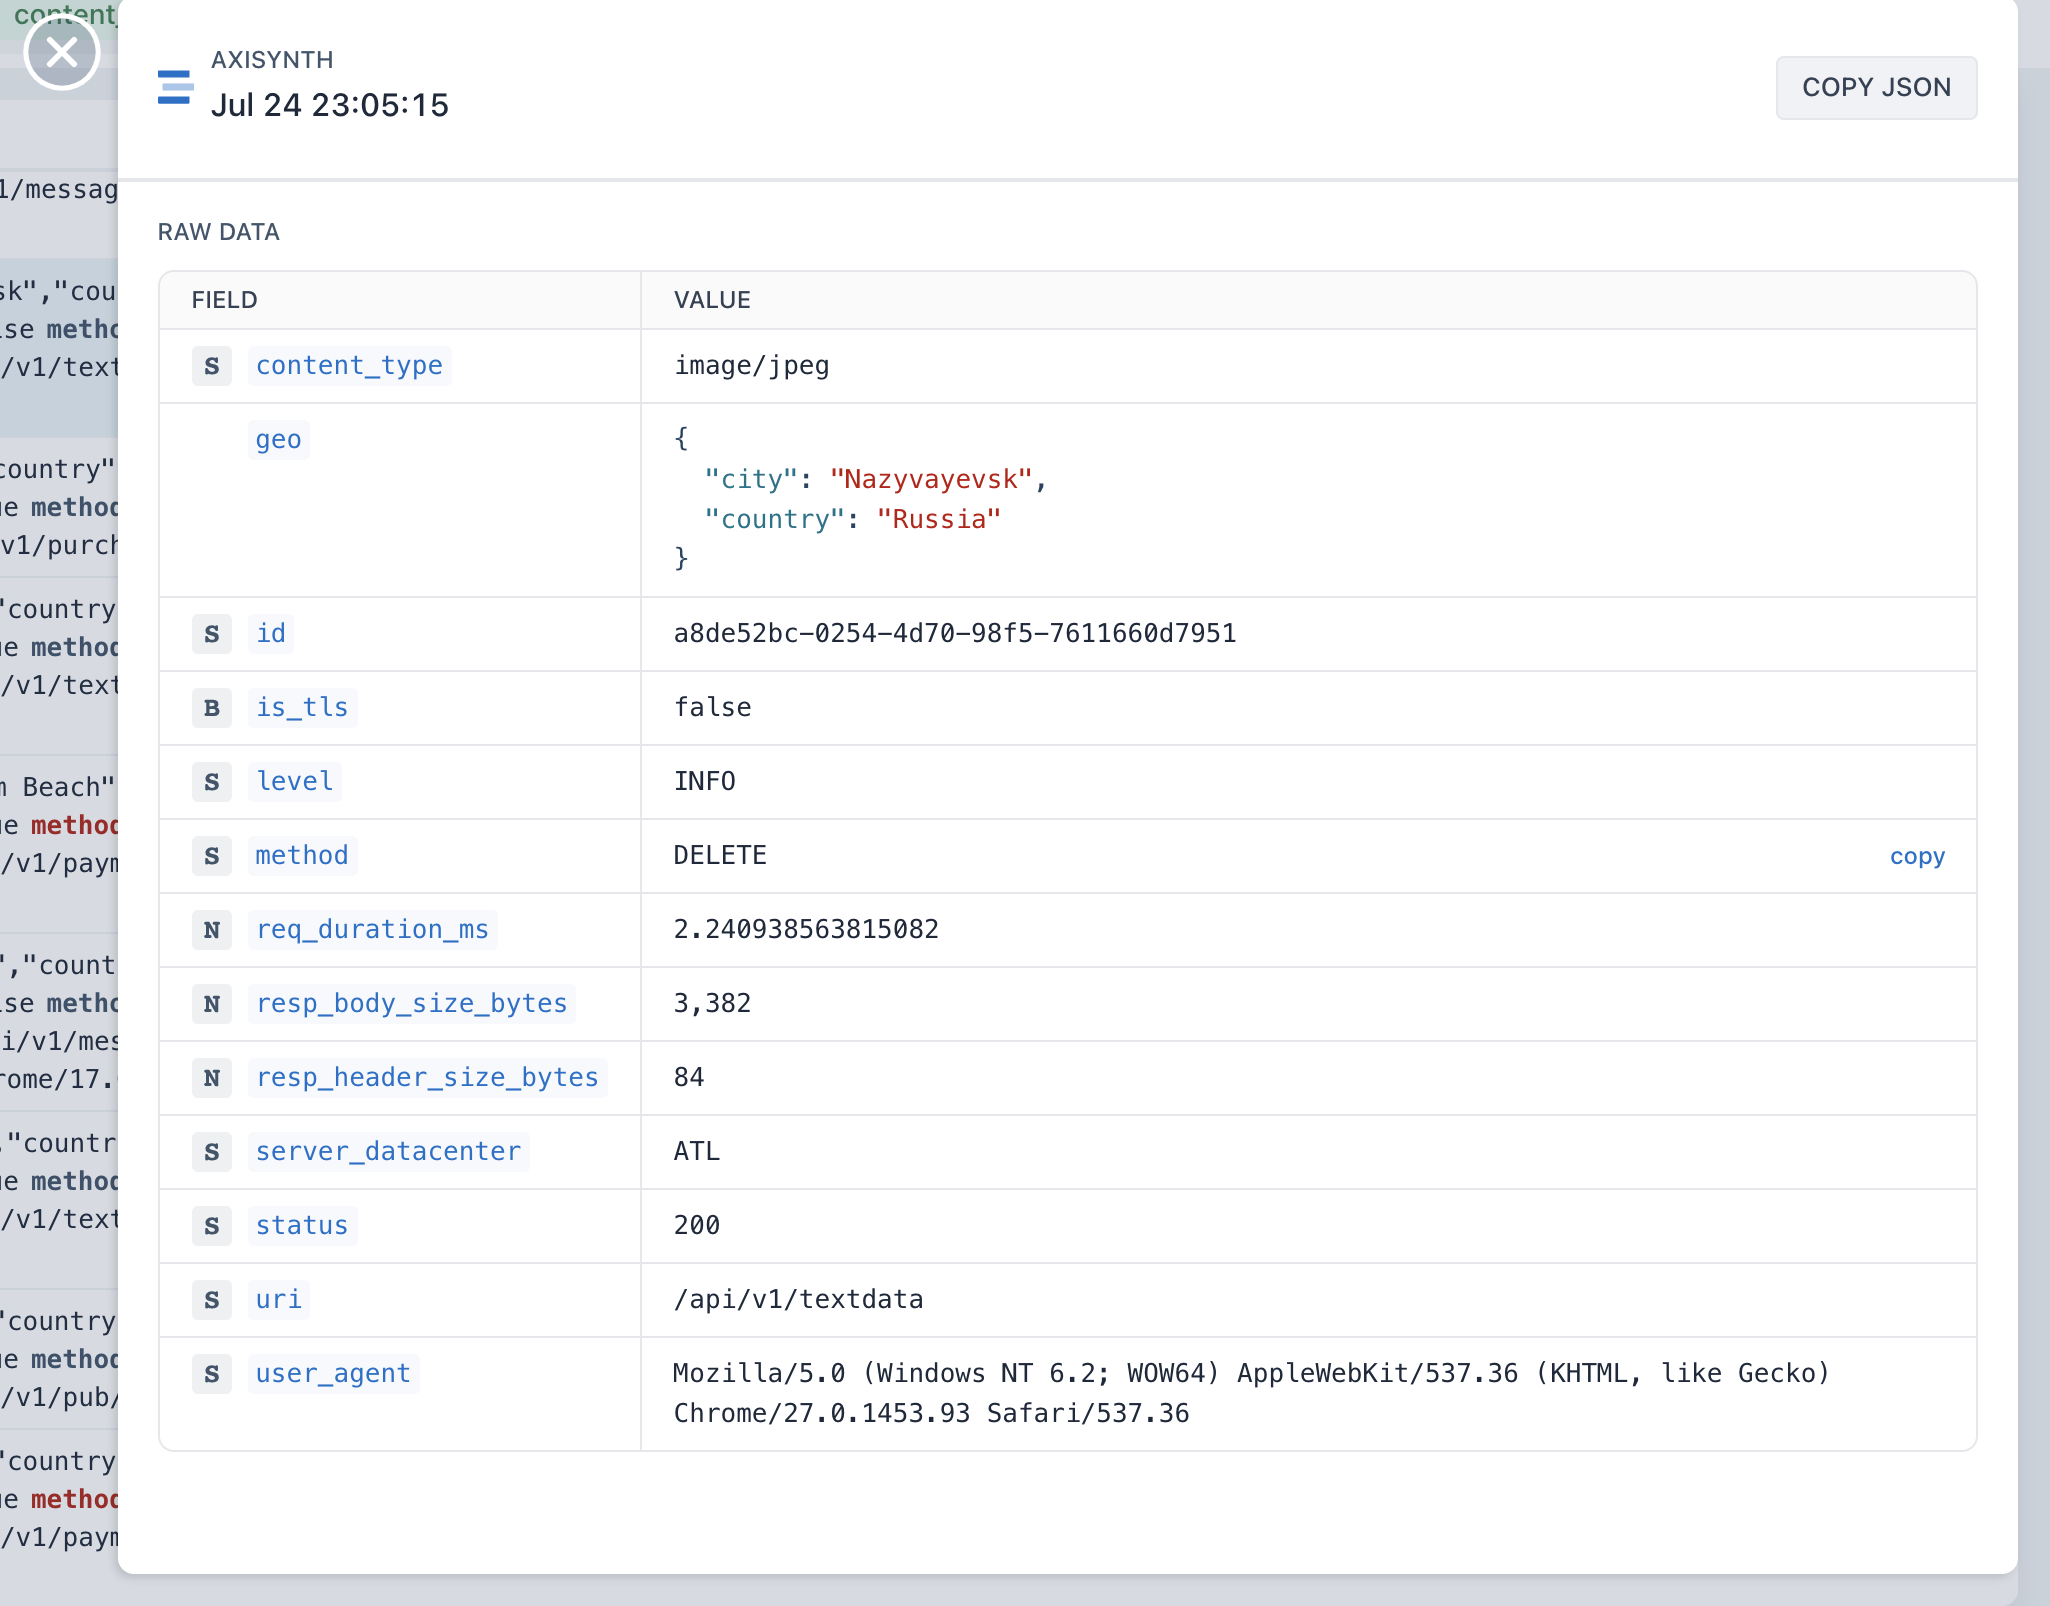
- Click on any event after running the filter builder, you will see the
VALUEofcontent_typeisimage/jpeg, and themethodisDELETE.
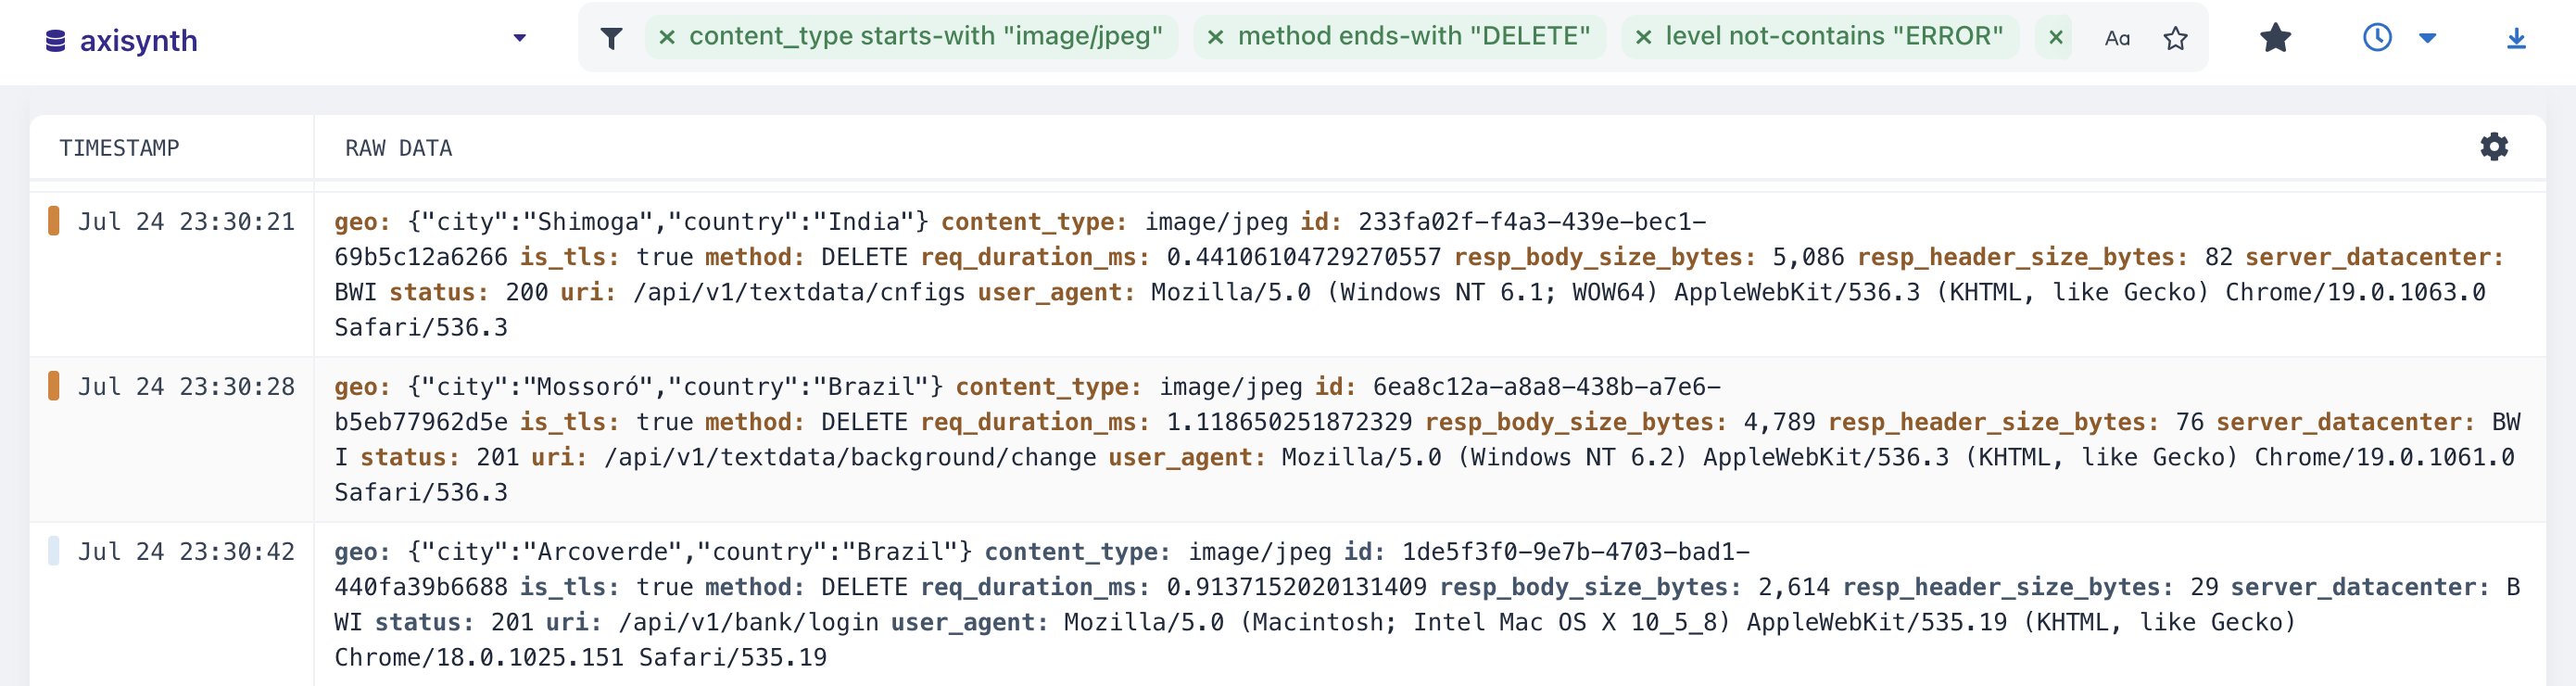
- Create and add more tag operators to your filter to get all the events you processed after running the filter builder.
- Hover to the settings icon on the stream page. You can:
- Increase the text size
- Wrap and unwrap lines
- Highlight and strike out fields.
- Show and hide raw data
- Add fields into your Dataset Columns.
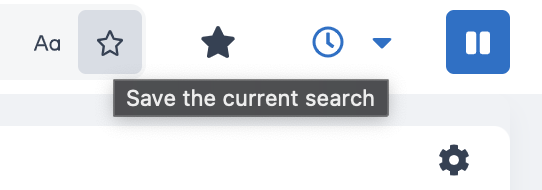
- You can explore other functionalities on your stream page, like saving your current search
- Apart from starring searches, you can choose to see the events when it occurred at a particular time interval. The stream has two modes:
- Live stream (default): constantly checks for new events and presents them in the stream.
- Time Range: shows the events that fall within a particular time interval.
- View your starred queries on the toolbar.
- When you are ready to return to live streaming, simply click the (return) button as displayed in the gif.
- Clicking on the button again would pause the stream.
It’s done! ✅
Whew! If you can do all that, you are all set to be off to the races to build your own filters and instant searches.
If you have specific questions or issues configuring the file, I'd love to hear about them. Contact us here or ask a question in our Discord community!
You can also follow us on Twitter and on our blog. And if you’ve enjoyed this post, please, take a second to share it on Twitter.
Good luck!
References for the road
- Working with Axiom filters.
- Working with special field operators.
- Getting started with Streaming on Axiom.
- Working with Aggregations.


