
In this tutorial, I will show you how to monitor and analyze your heartbeat uptime metrics, health, and performance of your web applications on Axiom.
Heartbeat is a lightweight daemon that you install on your local machine or remote server to frequently check the status of your services and determine whether they are available.
Whether you’re testing service from the same host or across the open web, Heartbeat makes it easy to generate uptime metrics, response time data and analyze them using Axioms Analytics feature. With Axiom, you can create your own visualizations, track and stream uptime metrics, and get Queries on your Heartbeat logs.
Axiom makes it easy to analyze and interpret uptime and response time data. Using our stream feature you can check the status of your services, watch as they are being shipped live, and determine their availability. With Heartbeat, you can periodically check the status of your services and ship metrics to Axiom.
Prerequisites
- Heartbeat 7.12 or lower installed on your machine.
- Axiom dataset & token.
- Heartbeat monitors configuration
After this tutorial, you will be able to:
- Analyze your uptime metrics from Heartbeat on Axiom
- Gather live events on your Heartbeat data.
- Customize dashboard and create alerts.
- Run aggregations on your uptime metrics logs.
Let’s get to it 🎗
- Visit our docs to copy, edit and configure your monitors to ship uptime metrics to Axiom
hostsandapi_keyon the Heartbeat Configuration that sends metrics data to Axiom.
# Disable index lifecycle management (ILM)
setup.ilm.enabled: false
heartbeat.monitors:
- type: icmp
  schedule: '*/5 * * * * * *'
  hosts: ["myhost"]
  id: my-icmp-service
  name: My ICMP Service

- type: tcp
  schedule: '@every 5s'
  hosts: ["myhost:12345"]
  mode: any
  id: my-tcp-service

- type: http
  schedule: '@every 5s'
  urls: ["http://example.net"]
  service.name: apm-service-name
  id: my-http-service
  name: My HTTP Service

output.elasticsearch:
  hosts: [""$YOUR_AXIOM_URL:443/api/v1/datasets/<dataset>/elastic"]
  # api_key can be your ingest or personal token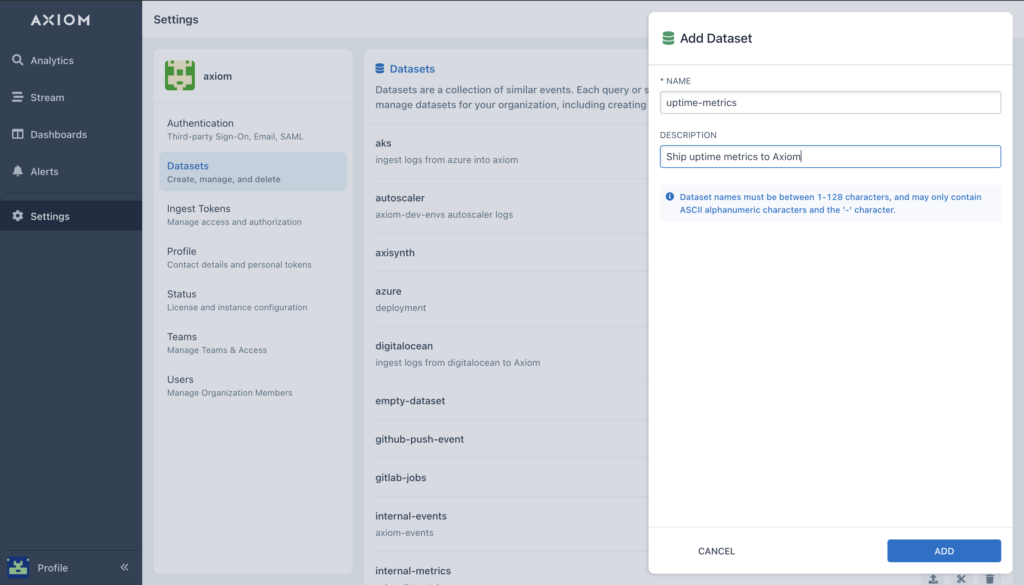
api_key: "user:token"- Create your dataset for your Heartbeat logs by selecting Settings → Datasets.
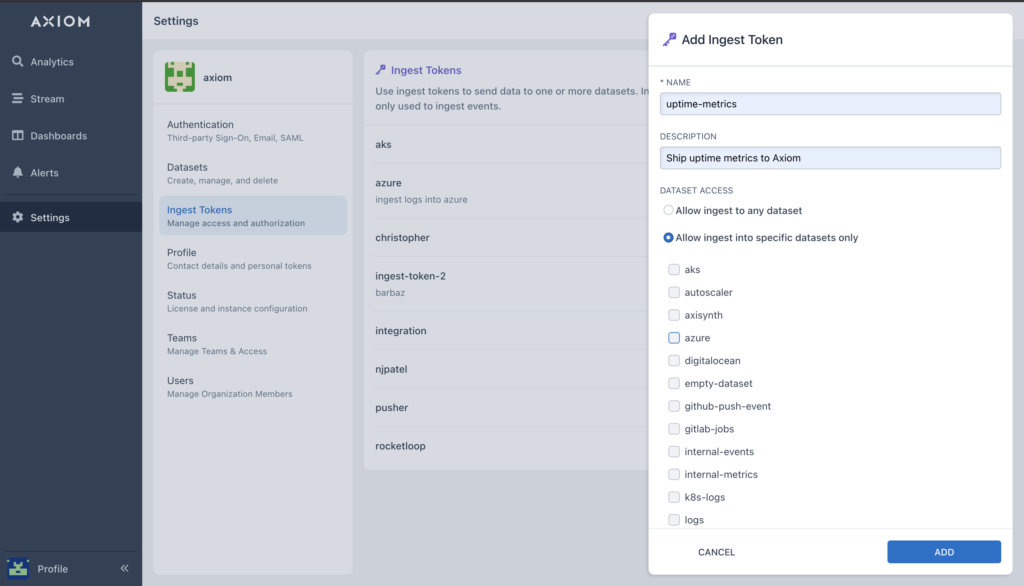
- Generate your ingest token,
- On the Axiom UI, click on settings, select ingest token.
- Select Add ingest token.
- Enter a name and description and select** ADD.**
- Copy the generated token to your clipboard. Once you navigate from the page, the token can be seen again by selecting Ingest Tokens.
-
Update the changes with the new **Host URL and Dataset name **on your configuration file. You can now Heartbeat logs into Axiom.
-
Analyse and get queries using different aggregations on the Axiom UI. Run aggregations across all or a subset of events in your uptime-metrics dataset to visualize the output.
- Live-stream events as they are ingested to know what is going on in the context of the entire uptime metrics logs.
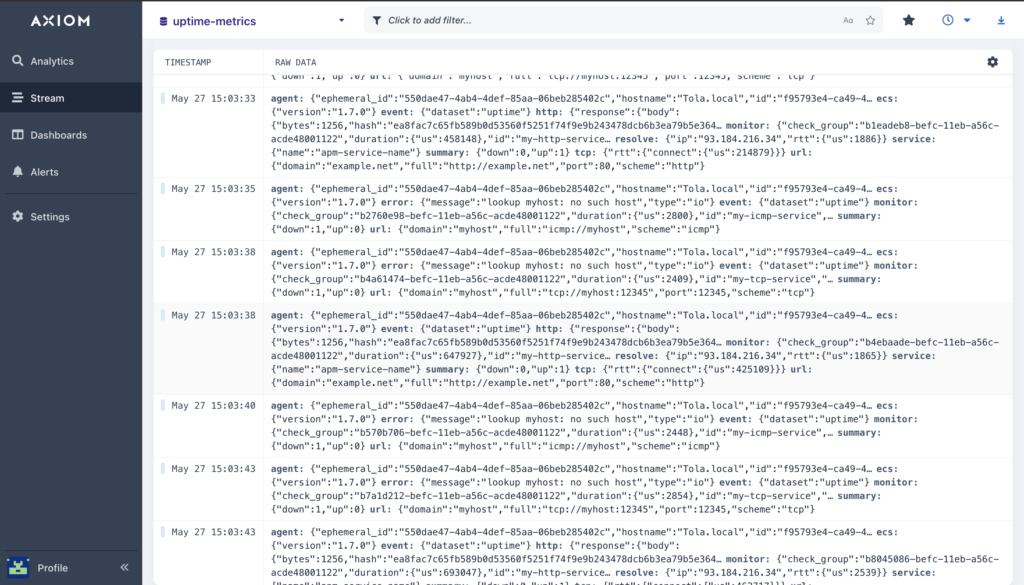
- You can also filter streams of events from your uptime metrics logs to have an overview of all the important information, and finally inspect each individual event.
- You can also set up monitors and notifiers by selecting Alerts on the dashboard, with this you will get alerts when certain actions are met.
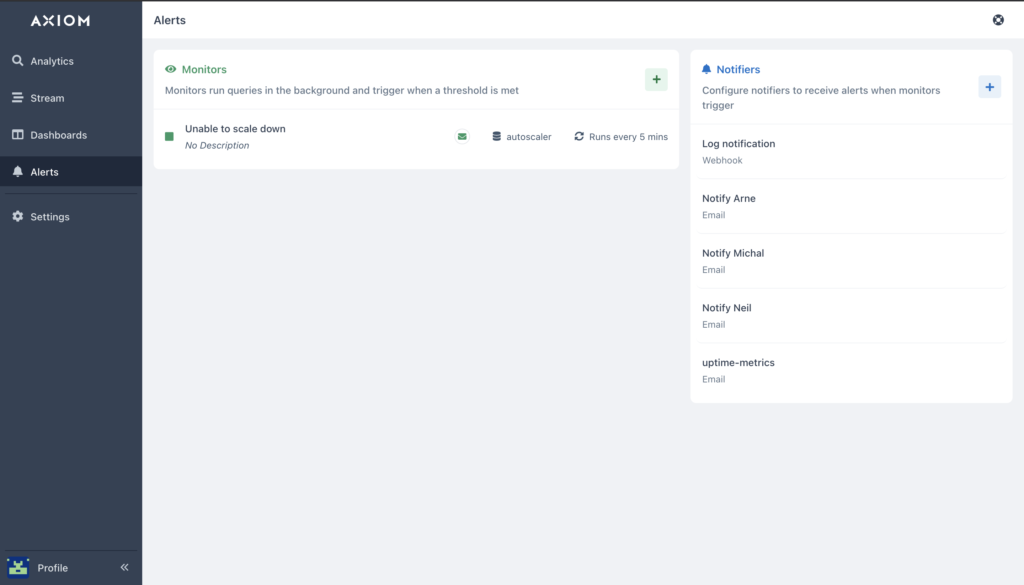
- With Monitors, you can set up and run queries over different periods. After configuring and setting up queries, you can confirm if the values created from the results exceed the threshold. If it exceeds the threshold value you configured, then the monitor would trigger and send an alert to the type of Notifier you added to the monitor.
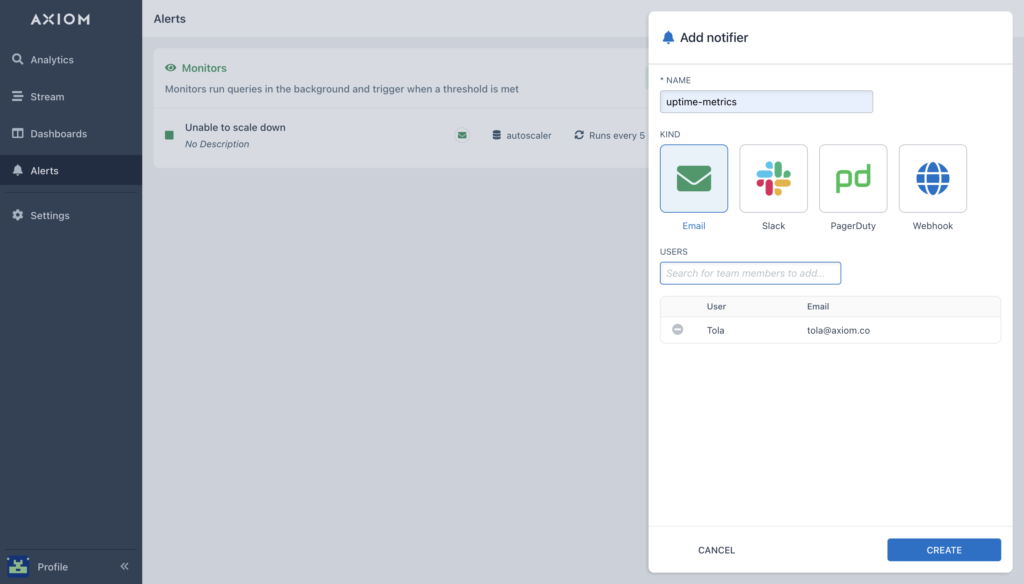
- Before you configure your monitor, set up your notifier this is how your monitors will alert you when they are triggered.
You can set up different notifications through four different notifiers:
- Slack
- PagerDuty
- Webhook
- Fill up the Monitor options, here the:
- Name of my monitor is: Uptime-metrics
- Description – Monitor uptime-metrics logs. Inserting a description is very useful, especially for your team members. Helpful for team members so that they can know what it was created for.
- For Trigger options, I set the comparison type to above-or-equal to the value of 2. 2 is the value to compare the results of the query to.
- Specify the frequency and time range for your monitor. Here I configured mine to check this monitor for every 2 minutes with data from the last 1 minute.
- Select your notification option. Here I’m selecting the notification via Email which I configured in step 8.
- Select the dataset in which you ingested logs from Heartbeat earlier.
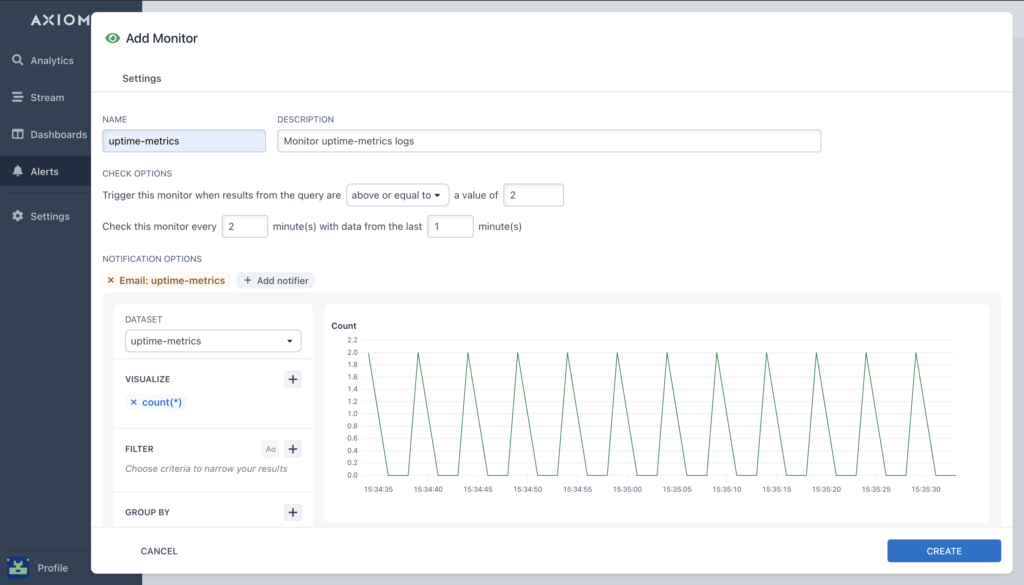
-
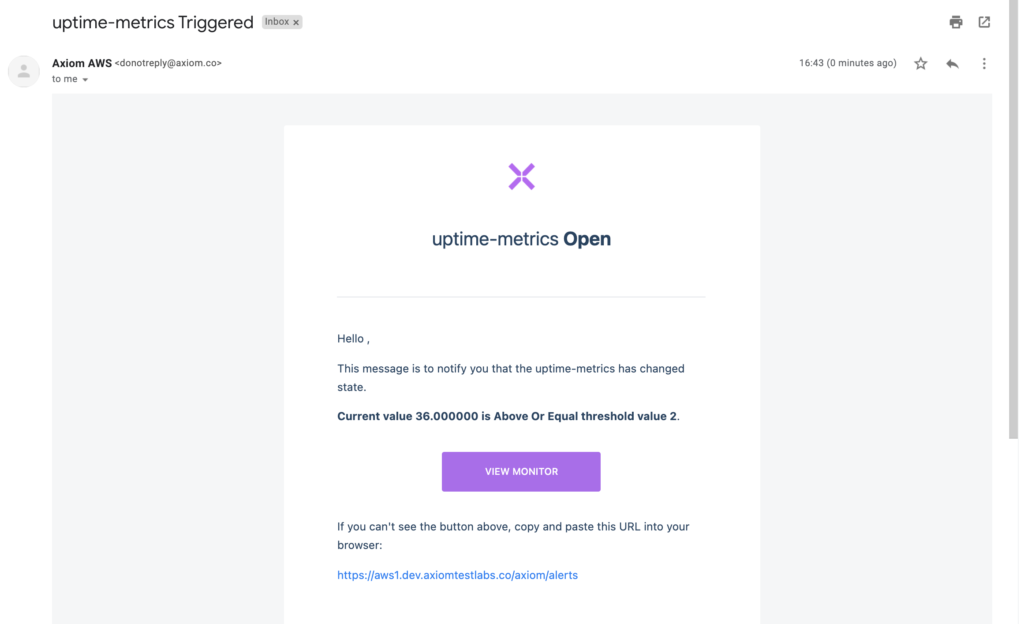
Wait for your query to run, Here I configured my query using the count aggregation. It will trigger the monitor and send an alert to my email when the value of 2 is above or equal to the threshold value of 2.
-
Check your email to confirm if you received the trigger message. Here I received the alert that my Uptime-metrics alert has changed state. You can configure your monitors to get triggered at any
value,frequency,andtime range
-
Create a new Dashboard by selecting NEW DASHBOARD, you’ll see a dialog that asks you for the name and a description of your new dashboard. Select the (+) button to add your first charts to your dashboard. Click on it to build your first query.
-
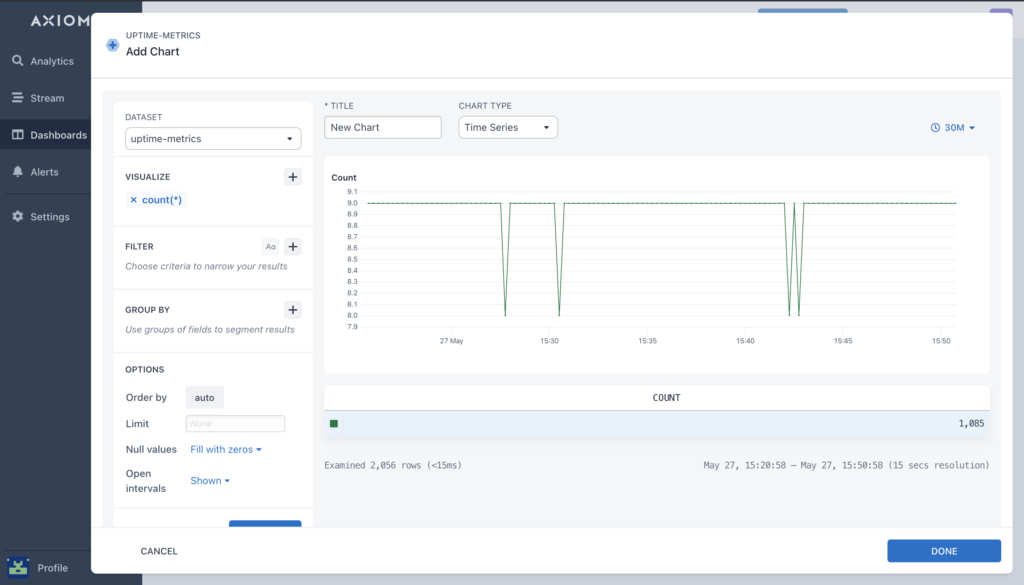
To create a new Query for your Dashboard, click on the (+) sign at the top left corner. When you do so, the edit query slide-out dialog box will appear to begin the steps of creating queries for your Dashboard experience.
- Choose your dataset, you want to query
- Choose the specific visualization (avg, sum, count, etc) to see charts:
- After creating your first Query in your Dashboard, you can also add more datasets and aggregations to your existing dashboards. This lets you visualize all queries in a structured view.
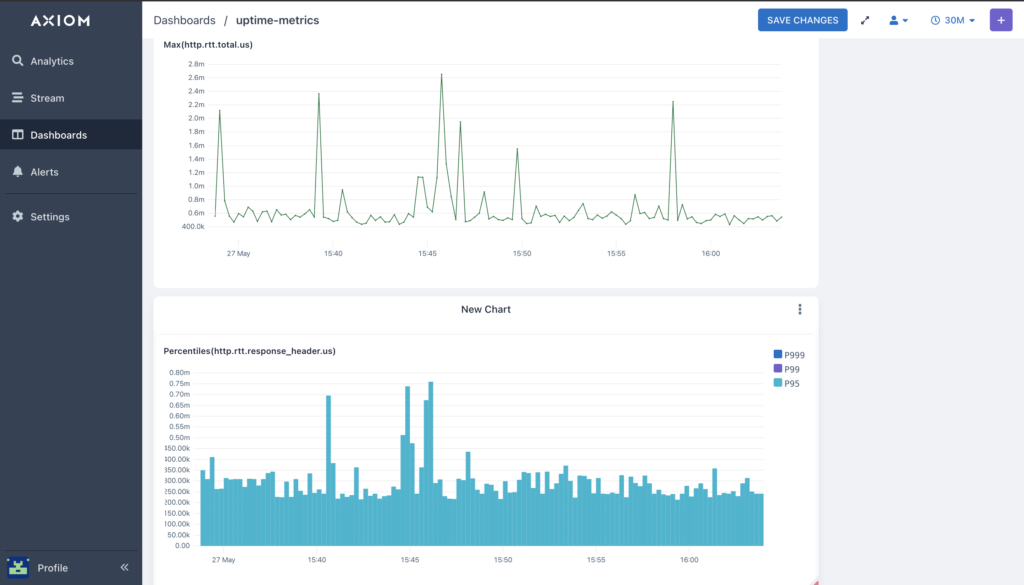
From here, you can now add more queries and get visualization from different aggregations and also explore what else Axiom can do!
That’s it…for now 😇
You can see how fast and easy is it to ship uptime metrics to Axiom.
If you have specific questions or issues configuring the file, I’d love to hear about them. Contact us here or ask a question in our Discord community!
You can also follow us on Twitter and on our blog. And if you’ve enjoyed this post, please, take a second to share it on Twitter.
- Read more about Heartbeat → Axiom Configuration on our docs.
- Working with Virtualization.
- Working with Aggregations.
- Read more about other data shippers we support on our official docs.


