Send OpenTelemetry data from a Golang app to Axiom
OpenTelemetry offers a single set of APIs and libraries that standardize how you collect and transfer telemetry data. This guide focuses on setting up OpenTelemetry in a Go application to send traces to Axiom.
Prerequisites
- Go 1.19 or higher: Ensure you have Go version 1.19 or higher installed in your environment.
- Go Application: Use your own application written in Go or start with the provided
main.gosample below. - Axiom API Key: Obtain an Axiom API Key with ingesting and querying permissions from your Access Settings. If you don’t have an Axiom account, sign up for a free account at Axiom.
- Dataset: Create a dataset in Data Settings. This is where traces will be sent.
Installing Dependencies
First, run the following in your terminal to install the necessary Go packages:
go get go.opentelemetry.io/otel
go get go.opentelemetry.io/otel/exporters/otlp/otlptrace/otlptracehttp
go get go.opentelemetry.io/otel/sdk/resource
go get go.opentelemetry.io/otel/sdk/trace
go get go.opentelemetry.io/otel/semconv/v1.24.0
go get go.opentelemetry.io/otel/trace
go get go.opentelemetry.io/contrib/instrumentation/net/http/otelhttp
go get go.opentelemetry.io/otel/propagation
This installs the OpenTelemetry Go SDK, the OTLP (OpenTelemetry Protocol) trace exporter, and other necessary packages for instrumentation and resource definition.
Initializing a Go module and managing dependencies
Before installing the OpenTelemetry dependencies, ensure your Go project is properly initialized as a module and all dependencies are correctly managed. This step is important for resolving import issues and managing your project's dependencies effectively.
Initialize a Go module
If your project is not already initialized as a Go module, run the following command in your project's root directory. This step creates a go.mod file which tracks your project's dependencies.
go mod init <module-name>Replace <module-name> with your project's name or the GitHub repository path if you plan to push the code to GitHub. For example, go mod init github.com/yourusername/yourprojectname.
Manage dependencies
After initializing your Go module, tidy up your project's dependencies. This ensures that your go.mod file accurately reflects the packages your project depends on, including the correct versions of the OpenTelemetry libraries you'll be using.
Run the following command in your project's root directory:
go mod tidyThis command will download the necessary dependencies and update your go.mod and go.sum files accordingly. It's a good practice to run go mod tidy after adding new imports to your project or periodically to keep dependencies up to date.
HTTP server configuration (main.go)
main.go is the entry point of the application. It invokes InstallExportPipeline from exporter.go to set up the tracing exporter. It also sets up a basic HTTP server with OpenTelemetry instrumentation to demonstrate how telemetry data can be collected and exported in a simple web application context.
// main.go

package main

import (
   "context" // For managing request-scoped values, cancellation signals, and deadlines.
   "fmt" // For formatted I/O operations.
   "log" // For logging errors and information.
   "math/rand" // For generating pseudo-random numbers.
   "net" // For network I/O interfaces.
   "net/http" // For HTTP server and client operations.
   "os" // For platform-independent interface to operating system features.
   "os/signal" // For handling OS signals.
   "time" // For time-related operations.

   // OpenTelemetry imports for tracing and observability.
   "go.opentelemetry.io/contrib/instrumentation/net/http/otelhttp" // OpenTelemetry instrumentation for net/http.
   "go.opentelemetry.io/otel" // Core OpenTelemetry APIs for tracing.
)

func main() {
   // Main function serves as the entry point of the application
   if err := run(); err != nil {
       log.Fatalln(err) // Logs fatal errors and exits the application
   }
}

func run() error {
   // Context to handle interrupt signals for a graceful shutdown
   ctx, stop := signal.NotifyContext(context.Background(), os.Interrupt)
   defer stop() // Ensures the stop function is called on exit

   otelShutdown, err := SetupTracer() // Initializes OpenTelemetry tracing
   if err != nil {
       return err
   }
   defer func() { // Deferred function to handle OpenTelemetry shutdown
       if shutdownErr := otelShutdown(ctx); shutdownErr != nil {
           log.Printf("failed to shutdown OpenTelemetry: %v", shutdownErr)
       }
   }()

   // Configuration of the HTTP server
   srv := &http.Server{
       Addr:         ":8080",               // Server address
       BaseContext:  func(_ net.Listener) context.Context { return ctx },
       ReadTimeout:  5 * time.Second,       // Server read timeout
       WriteTimeout: 15 * time.Second,      // Server write timeout
       Handler:      newHTTPHandler(),      // HTTP handler
   }

   // Start server in a goroutine to handle requests concurrently
   go func() {
       if err := srv.ListenAndServe(); err != http.ErrServerClosed {
           log.Fatalf("HTTP server ListenAndServe: %v", err) // Log fatal errors during server startup
       }
   }()

   <-ctx.Done() // Wait for interrupt signal

   // Shutdown the server with a timeout for graceful exit
   shutdownCtx, cancel := context.WithTimeout(context.Background(), 30*time.Second)
   defer cancel() // Ensures cancel function is called on exit
   if err := srv.Shutdown(shutdownCtx); err != nil {
       log.Fatalf("HTTP server Shutdown: %v", err) // Log fatal errors during server shutdown
   }

   return nil
}

func newHTTPHandler() http.Handler {
   mux := http.NewServeMux() // HTTP request multiplexer

   // Function to handle specific routes with OpenTelemetry instrumentation
   handleFunc := func(pattern string, handlerFunc func(http.ResponseWriter, *http.Request)) {
       handler := otelhttp.WithRouteTag(pattern, http.HandlerFunc(handlerFunc))
       mux.Handle(pattern, handler) // Associate pattern with handler
   }

   handleFunc("/rolldice", rolldice) // Setup route for rolldice

   handler := otelhttp.NewHandler(mux, "/")
   return handler
}

func rolldice(w http.ResponseWriter, r *http.Request) {
   _, span := otel.Tracer("example-tracer").Start(r.Context(), "rolldice")
   defer span.End() // Ensure span ends after function execution

   randGen := rand.New(rand.NewSource(time.Now().UnixNano())) // Local random generator for thread safety
   roll := 1 + randGen.Intn(6) // Simulate dice roll

   fmt.Fprintf(w, "Rolled a dice: %d\n", roll) // Send the result back to the client
}
Exporter configuration (exporter.go)
exporter.go is responsible for setting up the OpenTelemetry tracing exporter. It defines the resource attributes, initializes the tracer, and configures the OTLP (OpenTelemetry Protocol) exporter with appropriate endpoints and headers, allowing your application to send telemetry data to Axiom.
package main

import (
   "context" // For managing request-scoped values, cancellation signals, and deadlines.
   "crypto/tls" // For configuring TLS options, like certificates.

   // OpenTelemetry imports for setting up tracing and exporting telemetry data.
   "go.opentelemetry.io/otel" // Core OpenTelemetry APIs for managing tracers.
   "go.opentelemetry.io/otel/attribute" // For creating and managing trace attributes.
   "go.opentelemetry.io/otel/exporters/otlp/otlptrace/otlptracehttp" // HTTP trace exporter for OpenTelemetry Protocol (OTLP).
   "go.opentelemetry.io/otel/propagation" // For managing context propagation formats.
   "go.opentelemetry.io/otel/sdk/resource" // For defining resources that describe an entity producing telemetry.
   "go.opentelemetry.io/otel/sdk/trace" // For configuring tracing, like sampling and processors.
   semconv "go.opentelemetry.io/otel/semconv/v1.24.0" // Semantic conventions for resource attributes.
)

const (
   serviceName           = "axiom-go-otel" // Name of the service for tracing.
   serviceVersion        = "0.1.0" // Version of the service.
   otlpEndpoint          = "api.axiom.co" // OTLP collector endpoint.
   bearerToken           = "Bearer $API_TOKEN" // Authorization token.
   deploymentEnvironment = "production" // Deployment environment.
)

func SetupTracer() (func(context.Context) error, error) {
   ctx := context.Background()
   return InstallExportPipeline(ctx) // Setup and return the export pipeline for telemetry data.
}

func Resource() *resource.Resource {
   // Defines resource with service name, version, and environment.
   return resource.NewWithAttributes(
       semconv.SchemaURL,
       semconv.ServiceNameKey.String(serviceName),
       semconv.ServiceVersionKey.String(serviceVersion),
       attribute.String("environment", deploymentEnvironment),
   )
}

func InstallExportPipeline(ctx context.Context) (func(context.Context) error, error) {
   // Sets up OTLP HTTP exporter with endpoint, headers, and TLS config.
   exporter, err := otlptracehttp.New(ctx,
       otlptracehttp.WithEndpoint(otlpEndpoint),
       otlptracehttp.WithHeaders(map[string]string{
           "Authorization":   bearerToken,
           "X-AXIOM-DATASET": "$DATASET_NAME",
       }),
       otlptracehttp.WithTLSClientConfig(&tls.Config{}),
   )
   if err != nil {
       return nil, err
   }

   // Configures the tracer provider with the exporter and resource.
   tracerProvider := trace.NewTracerProvider(
       trace.WithBatcher(exporter),
       trace.WithResource(Resource()),
   )
   otel.SetTracerProvider(tracerProvider)

   // Sets global propagator to W3C Trace Context and Baggage.
   otel.SetTextMapPropagator(propagation.NewCompositeTextMapPropagator(
       propagation.TraceContext{},
       propagation.Baggage{},
   ))

   return tracerProvider.Shutdown, nil // Returns a function to shut down the tracer provider.
}
Run the app
To run the application, execute both exporter.go and main.go. Use the command go run main.go exporter.go to start the application. Once your application is running, traces collected by your application are exported to Axiom. The server starts on the specified port, and you can interact with it by sending requests to the /rolldice endpoint.
For example, if you are using port 8080, your application will be accessible locally at:
http://localhost:8080/rolldiceThis URL will direct your requests to the /rolldice endpoint of your server running on your local machine.
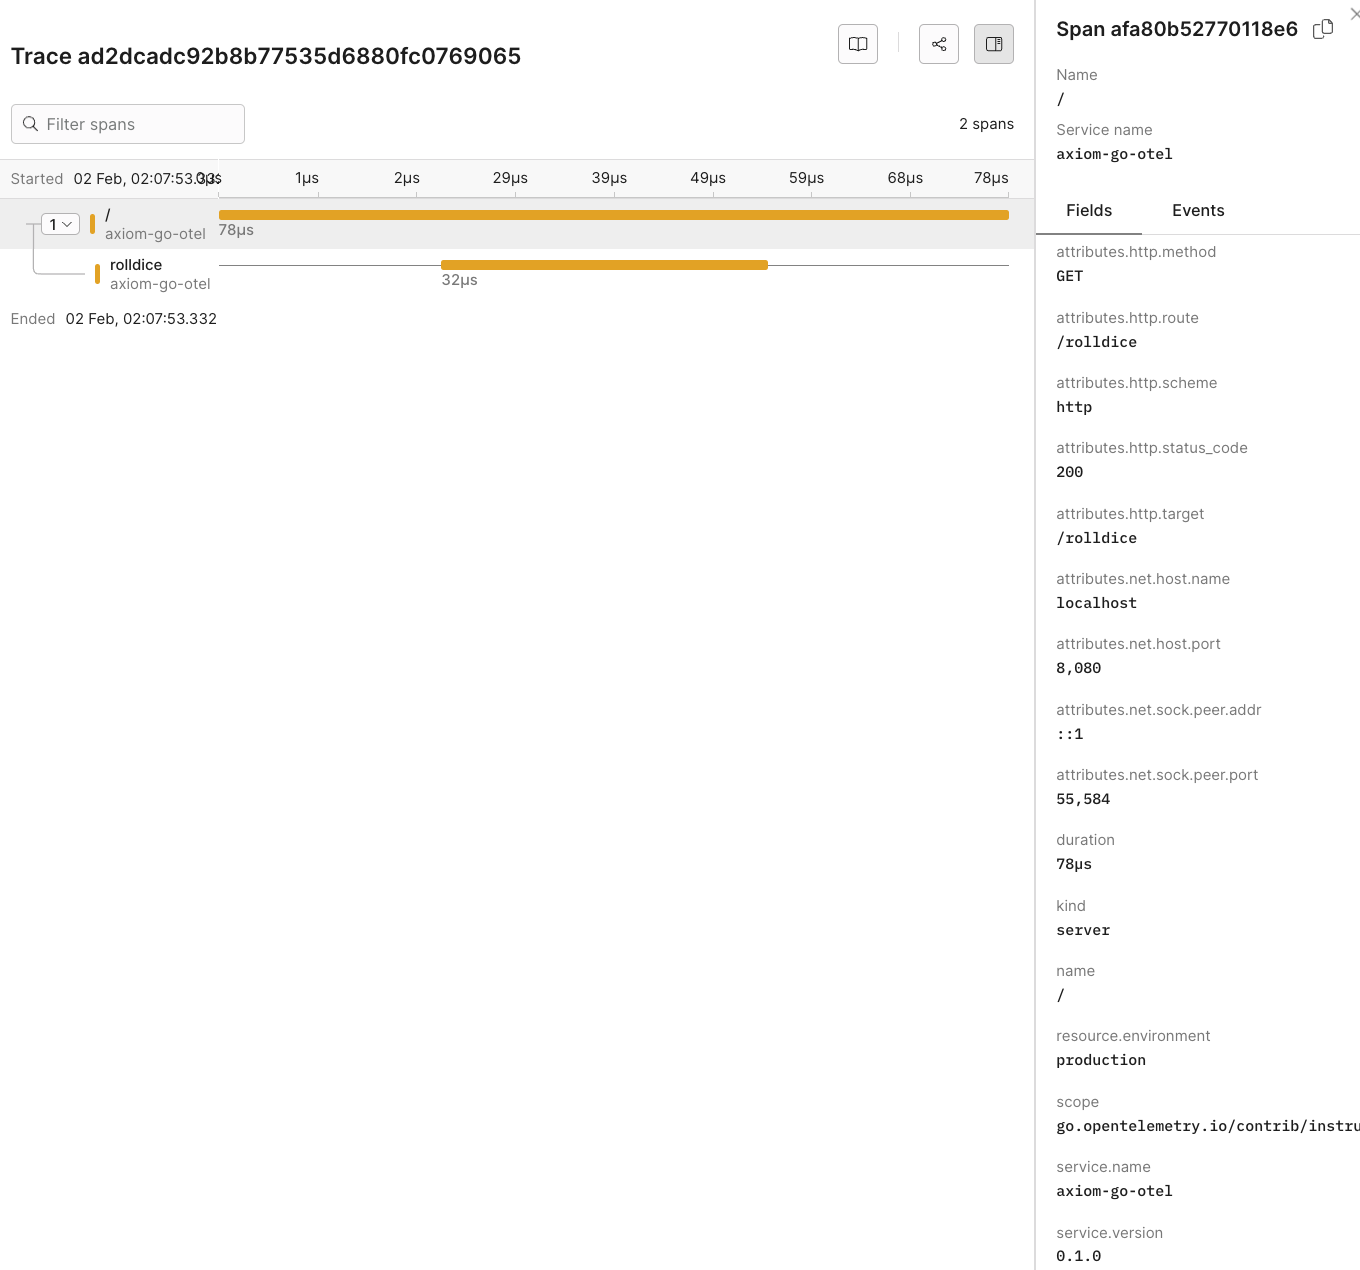
Observe the telemetry data in Axiom
After deploying your application, you can log into your Axiom account to view and analyze the telemetry data. As you interact with your application, traces will be collected and exported to Axiom, where you can monitor and analyze your application’s performance and behavior.
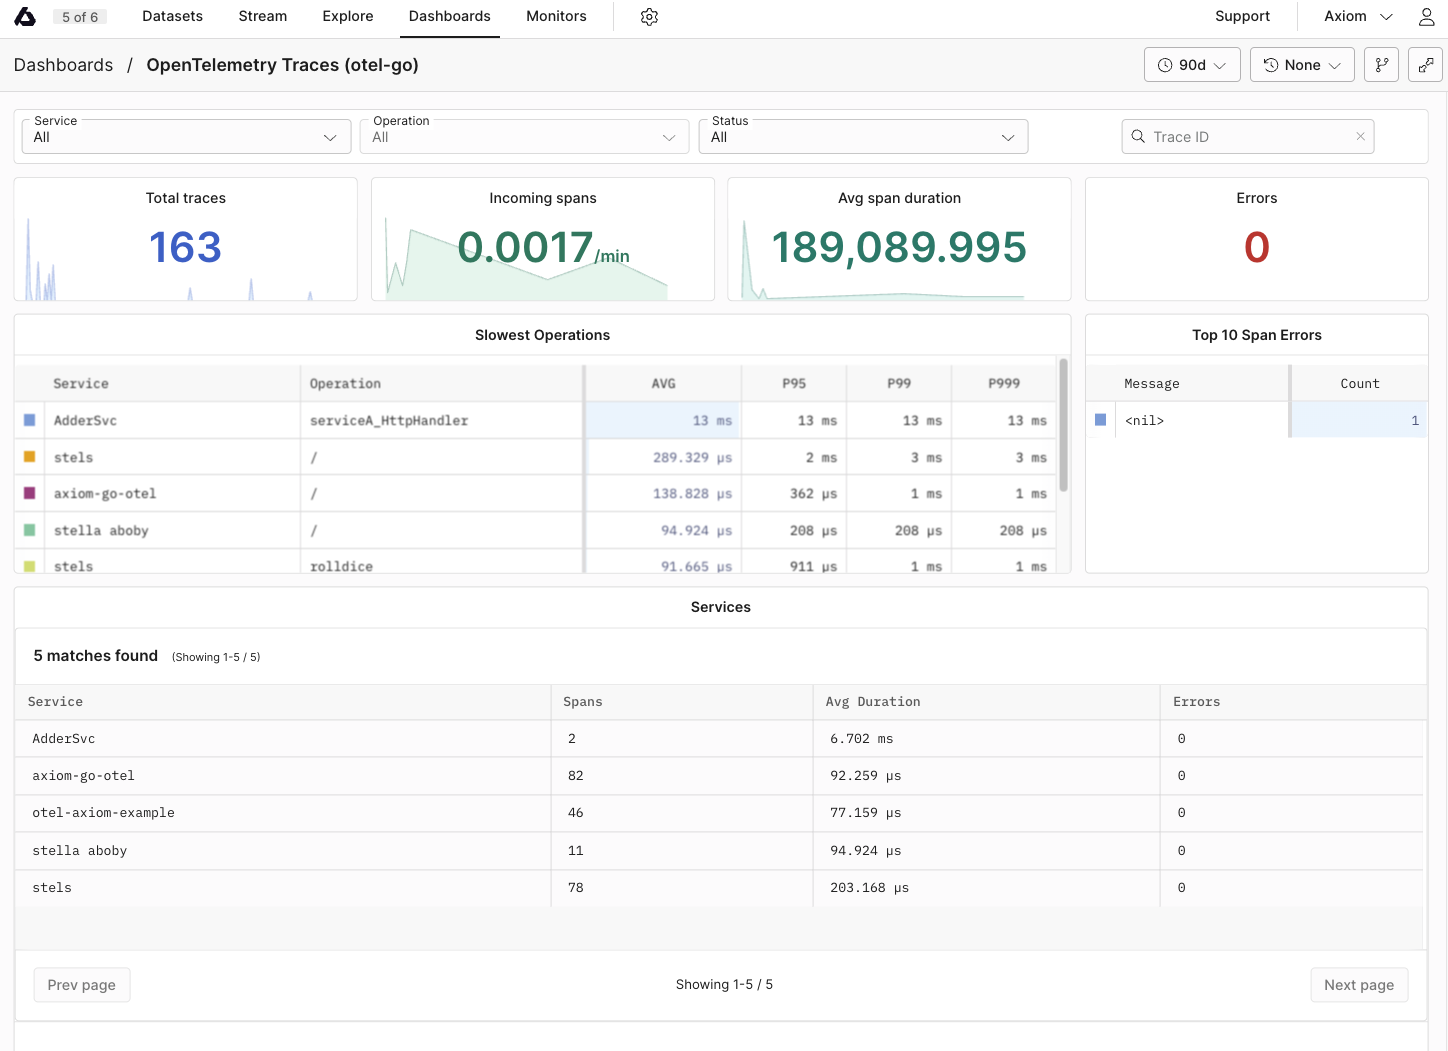
Dynamic OpenTelemetry traces dashboard
This data can then be further viewed and analyzed in Axiom's dashboard, providing insights into the performance and behavior of your application.
Send data from an existing Golang project
Manual Instrumentation
Manual instrumentation in Go involves managing spans within your code to track operations and events. This method offers precise control over what is instrumented and how spans are configured.
- Initialize the tracer:
Use the OpenTelemetry API to obtain a tracer instance. This tracer will be used to start and manage spans.
tracer := otel.Tracer("serviceName")- Create and manage spans:
Manually start spans before the operations you want to trace and ensure they are ended after the operations complete.
ctx, span := tracer.Start(context.Background(), "operationName")
defer span.End()
// Perform the operation here- Annotate spans:
Enhance spans with additional information using attributes or events to provide more context about the traced operation.
span.SetAttributes(attribute.String("key", "value"))
span.AddEvent("eventName", trace.WithAttributes(attribute.String("key", "value")))
Automatic Instrumentation
Automatic instrumentation in Go uses libraries and integrations that automatically create spans for operations, simplifying the addition of observability to your application.
- Instrumentation libraries:
Use OpenTelemetry-contrib libraries designed for automatic instrumentation of standard Go frameworks and libraries, such as net/http.
import "go.opentelemetry.io/contrib/instrumentation/net/http/otelhttp"- Wrap handlers and clients:
Automatically instrument HTTP servers and clients by wrapping them with OpenTelemetry's instrumentation. For HTTP servers, wrap your handlers with otelhttp.NewHandler.
http.Handle("/path", otelhttp.NewHandler(handler, "operationName"))- Minimal code changes:
After setting up automatic instrumentation, no further changes are required for tracing standard operations. The instrumentation takes care of starting, managing, and ending spans.
Reference
List of OpenTelemetry trace fields
| Field Category | Field Name | Description |
|---|---|---|
| Unique Identifiers | ||
| _rowid | Unique identifier for each row in the trace data. | |
| span_id | Unique identifier for the span within the trace. | |
| trace_id | Unique identifier for the entire trace. | |
| Timestamps | ||
| _systime | System timestamp when the trace data was recorded. | |
| _time | Timestamp when the actual event being traced occurred. | |
| HTTP Attributes | ||
| attributes.custom["http.host"] | Host information where the HTTP request was sent. | |
| attributes.custom["http.server_name"] | Server name for the HTTP request. | |
| attributes.http.flavor | HTTP protocol version used. | |
| attributes.http.method | HTTP method used for the request. | |
| attributes.http.route | Route accessed during the HTTP request. | |
| attributes.http.scheme | Protocol scheme (HTTP/HTTPS). | |
| attributes.http.status_code | HTTP response status code. | |
| attributes.http.target | Specific target of the HTTP request. | |
| attributes.http.user_agent | User agent string of the client. | |
| attributes.custom.user_agent.original | Original user agent string, providing client software and OS. | |
| Network Attributes | ||
| attributes.net.host.port | Port number on the host receiving the request. | |
| attributes.net.peer.port | Port number on the peer (client) side. | |
| attributes.custom["net.peer.ip"] | IP address of the peer in the network interaction. | |
| attributes.net.sock.peer.addr | Socket peer address, indicating the IP version used. | |
| attributes.net.sock.peer.port | Socket peer port number. | |
| attributes.custom.net.protocol.version | Protocol version used in the network interaction. | |
| Operational Details | ||
| duration | Time taken for the operation. | |
| kind | Type of span (e.g., server, client). | |
| name | Name of the span. | |
| scope | Instrumentation scope. | |
| service.name | Name of the service generating the trace. | |
| service.version | Version of the service generating the trace. | |
| Resource Attributes | ||
| resource.environment | Environment where the trace was captured, e.g., production. | |
| attributes.custom.http.wrote_bytes | Number of bytes written in the HTTP response. | |
| Telemetry SDK Attributes | ||
| telemetry.sdk.language | Language of the telemetry SDK (if previously not included). | |
| telemetry.sdk.name | Name of the telemetry SDK (if previously not included). | |
| telemetry.sdk.version | Version of the telemetry SDK (if previously not included). |
List of imported libraries
OpenTelemetry Go SDK
go.opentelemetry.io/otel
This is the core SDK for OpenTelemetry in Go. It provides the necessary tools to create and manage telemetry data (traces, metrics, and logs).
OTLP Trace Exporter
go.opentelemetry.io/otel/exporters/otlp/otlptrace/otlptracehttp
This package allows your application to export telemetry data over HTTP using the OpenTelemetry Protocol (OTLP). It's important for sending data to Axiom or any other backend that supports OTLP.
Resource and Trace Packages
go.opentelemetry.io/otel/sdk/resource and go.opentelemetry.io/otel/sdk/trace
These packages help define the properties of your telemetry data, such as service name and version, and manage trace data within your application.
Semantic Conventions
go.opentelemetry.io/otel/semconv/v1.24.0
This package provides standardized schema URLs and attributes, ensuring consistency across different OpenTelemetry implementations.
Tracing API
go.opentelemetry.io/otel/trace
This package offers the API for tracing. It enables you to create spans, record events, and manage context propagation in your application.
HTTP Instrumentation
go.opentelemetry.io/contrib/instrumentation/net/http/otelhttp
Used for instrumenting HTTP clients and servers. It automatically records data about HTTP requests and responses, which is essential for web applications.
Propagators
go.opentelemetry.io/otel/propagation
This package provides the ability to propagate context and trace information across service boundaries.